Running from the web app
You don't need a terminal to start runs: the web app can redo runs, run a commit's code on new tests, start tuning experiments and trigger CI jobs.
- Most actions need you to be logged in (top of the sidebar).
- Running code needs the commit's artifacts (its build and configuration files). If they were deleted, the commit page offers to restore them, but you'll likely need to rebuild.
- Your project needs a task runner (a cluster, Celery workers...) for runs to start. If none is set up, the tuning form warns you: ask whoever integrated QA-Board in your project.
Redo, stop and clean up runs
| To... | Where |
|---|---|
| Redo one run | On its card (Visualizations or Output Files views), ☰ menu → Redo |
| Redo the failed runs of a batch | Commit bar menu (☰) → Redo Failed Outputs |
| Redo deleted runs | Commit bar menu → Redo Deleted Outputs, or the button in the "N of the outputs below were deleted" message |
| Redo all runs of a batch | Commit bar menu → Redo All Outputs |
| Stop pending runs | The Stop runs button above the views, shown while runs are pending |
| Unblock a run stuck as pending | On its card, ☰ menu → Mark as Failed |
| Delete runs or only their files | Card ☰ menu (one run), or commit bar menu (failed runs, the batch, several batches) |
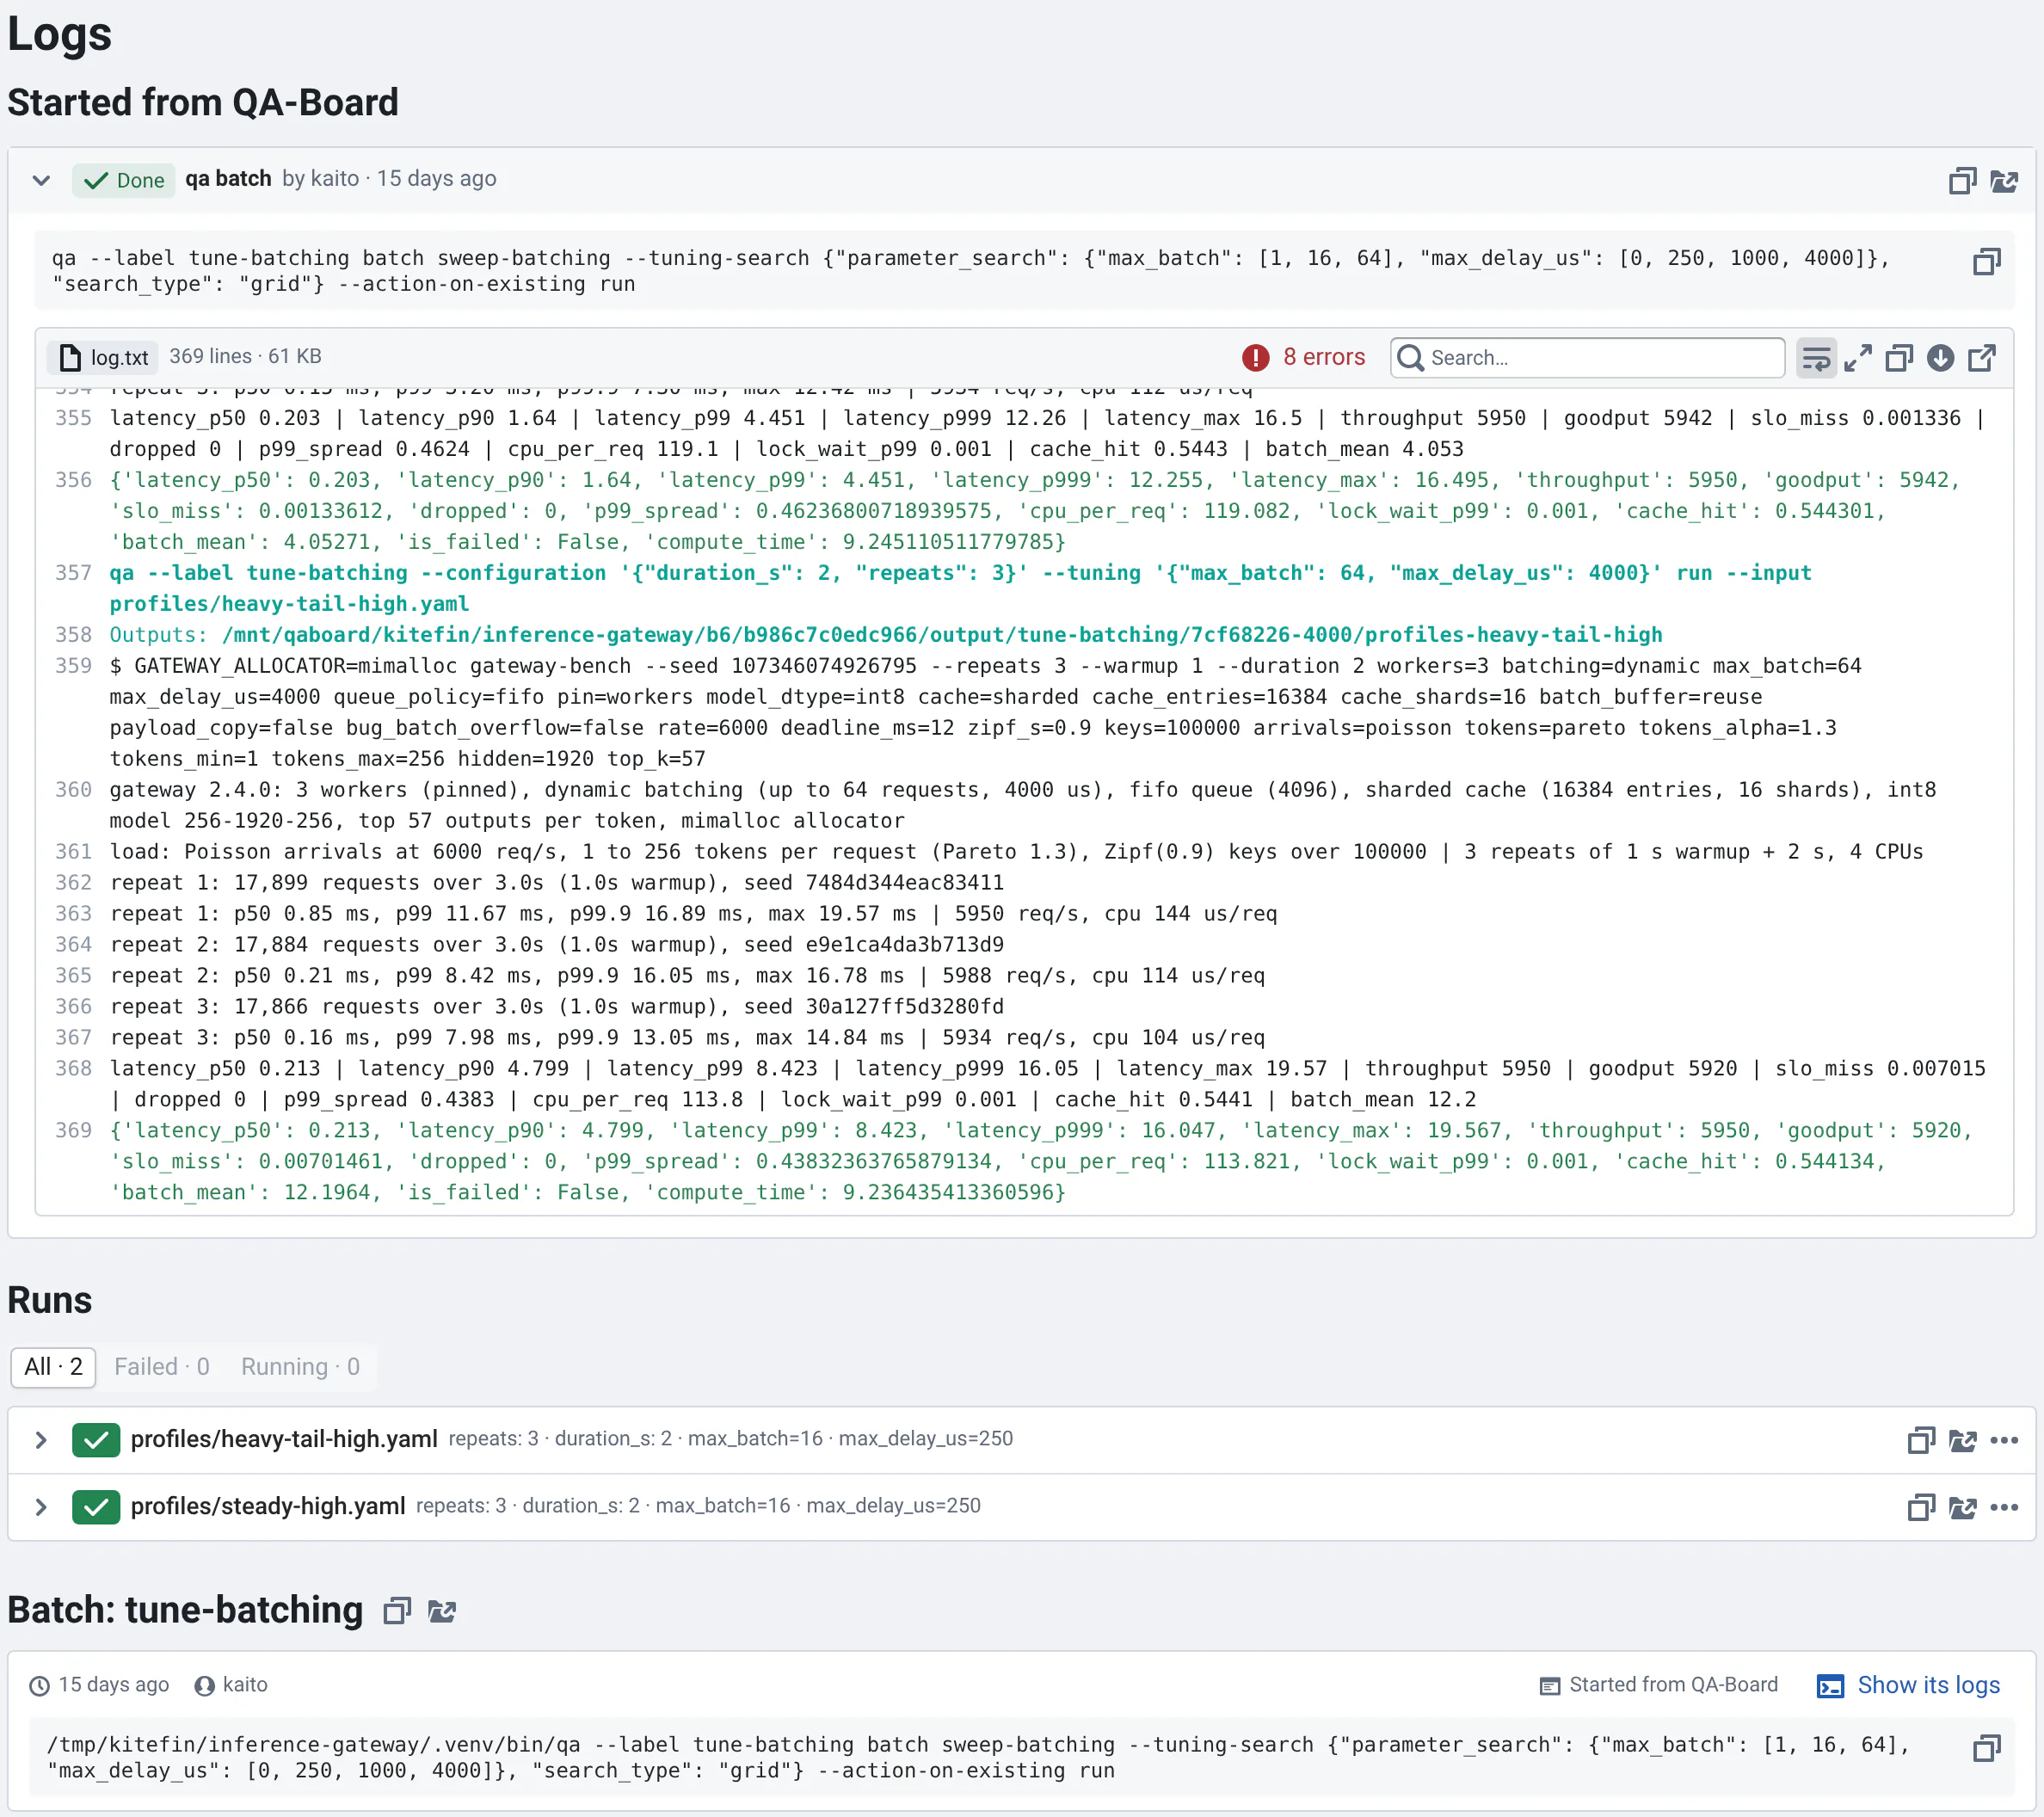
Redone runs use the commit's saved artifacts and the same input, configuration and parameters. They also use the runner they were started with, and the batch's runner settings, like how many runs can run at the same time: QA-Board starts them together, with a single qa batch. Its logs are in the Logs view, under "Started from QA-Board".
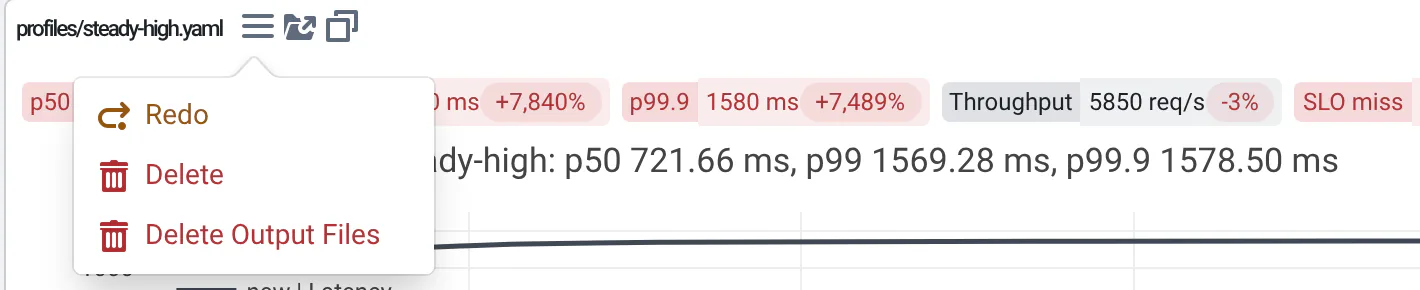
When you filter the batch's runs, the commit bar menu's redo actions only redo the runs that match the filter: Redo the N Filtered Outputs, Redo Filtered Failed Outputs...
The page refreshes by itself while runs are pending: follow their progress with the counters next to the filter box, or in the Logs view.
Delete actions are immediate. Milestones are protected: QA-Board won't delete batches or commits saved as milestones.
Running tests and tuning
To run a commit's code on other inputs, or with other parameters, open the commit page and select Run Tests / Tuning in the sidebar.
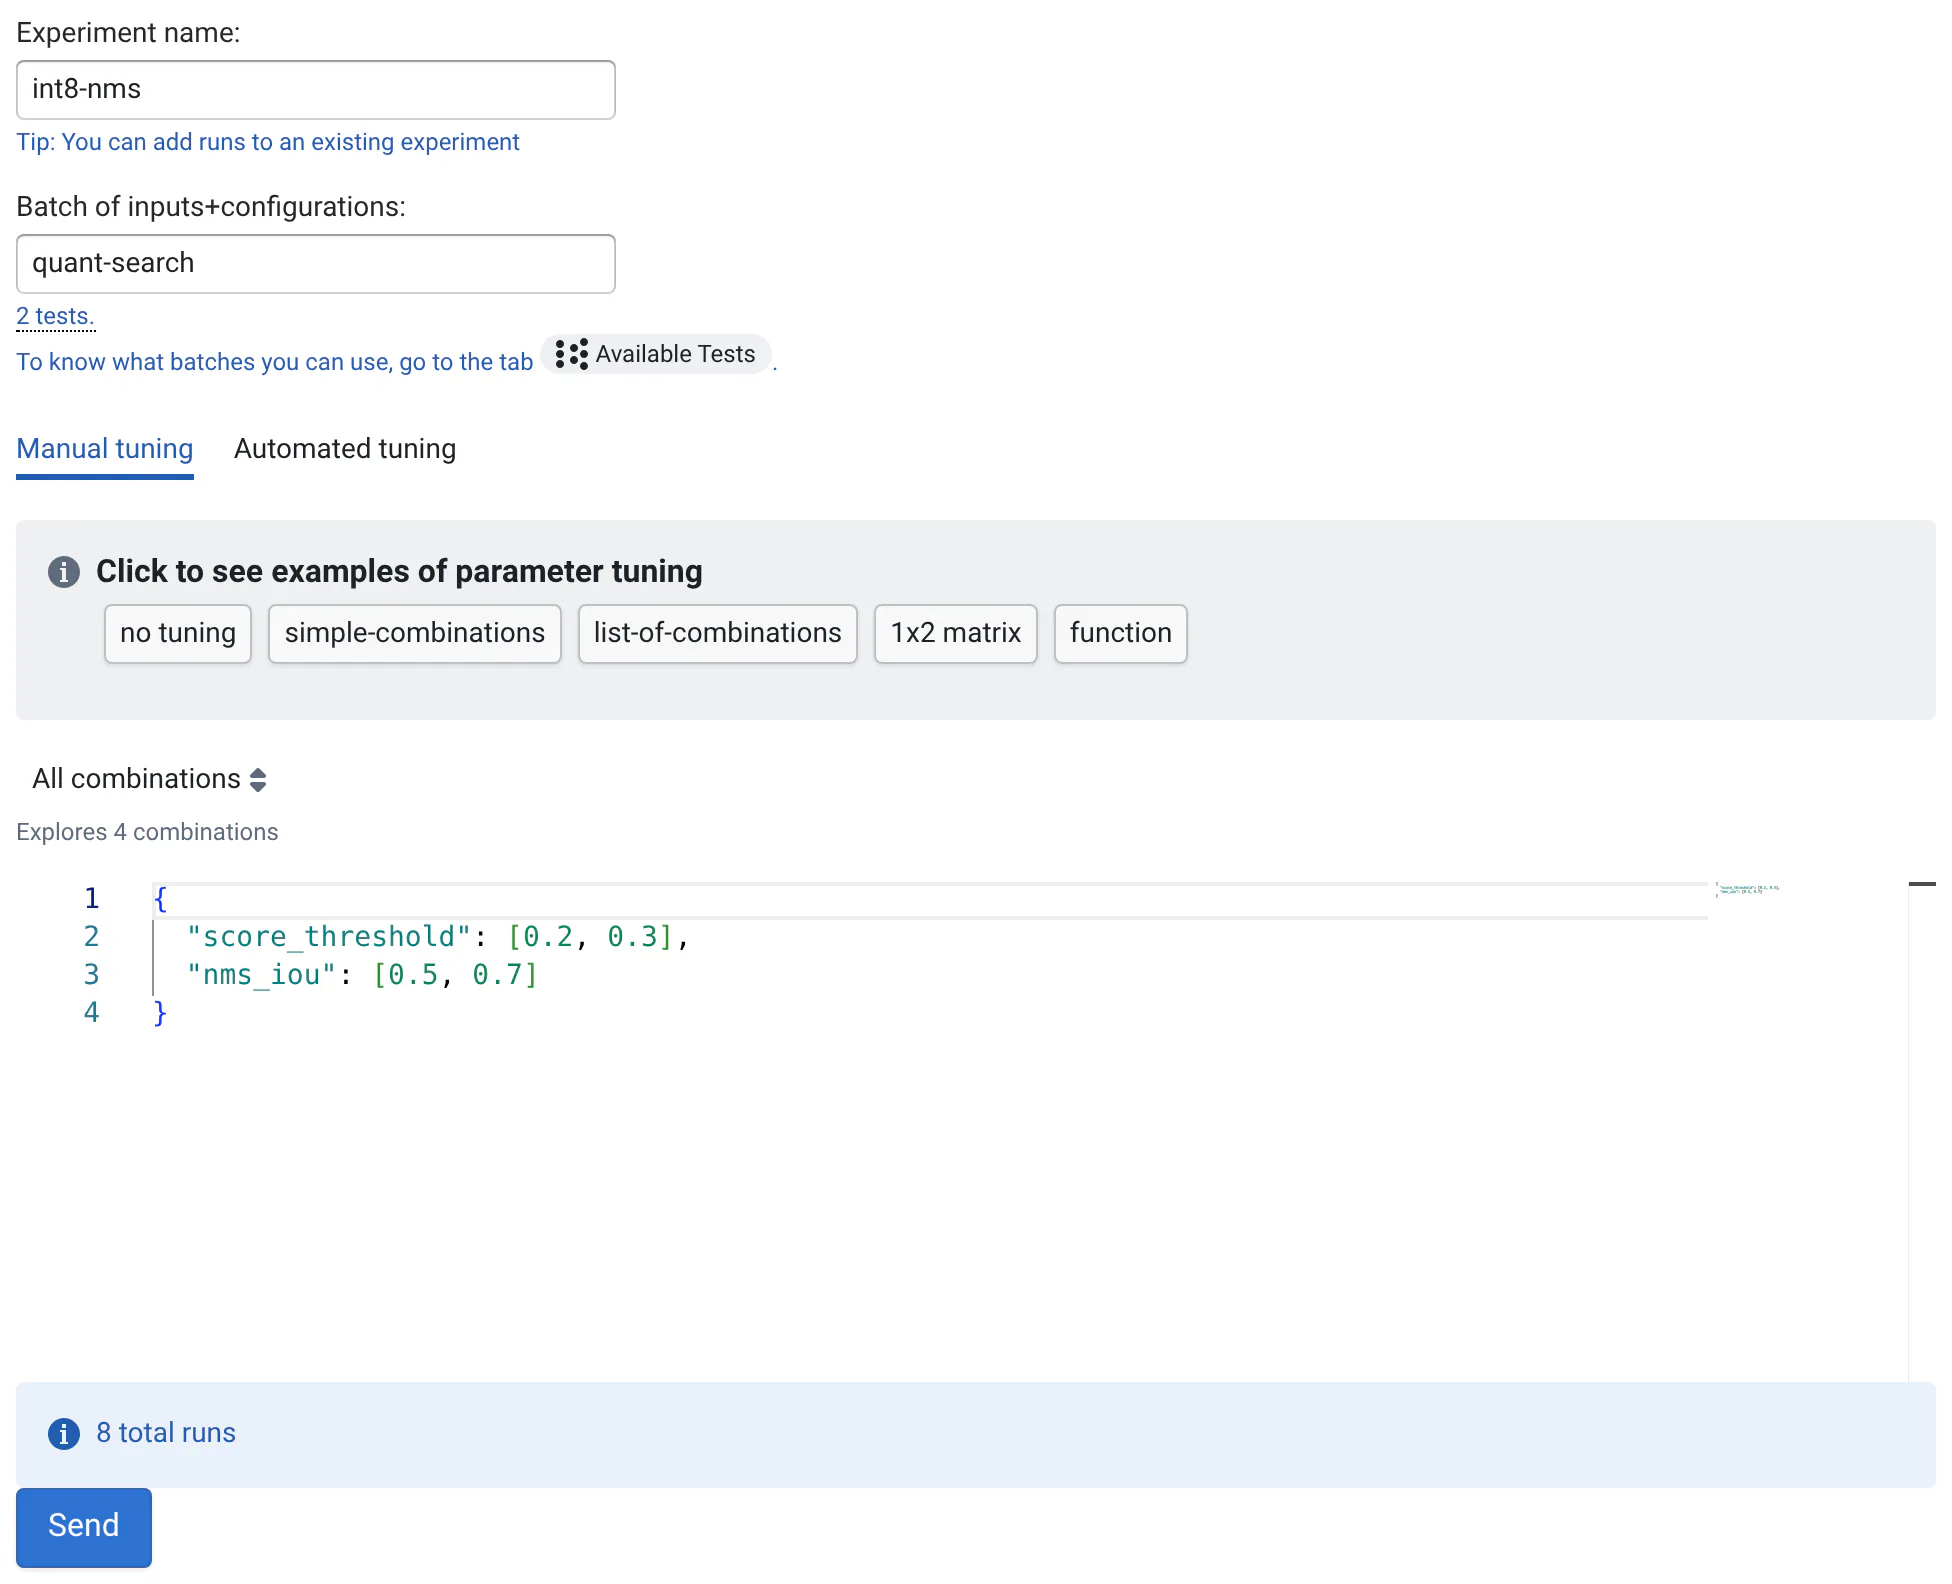
- Experiment name: the label of the new batch. Reusing the name of an existing experiment adds runs to it.
- Batch of inputs+configurations: the name of a batch of tests, like
my-batch, or several, likebatch-*. Hover N tests to check which inputs and configurations it includes. When the batch has no tests, a warning under it says why (a batch file missing from the commit's artifacts, a batch defined nowhere, inputs not found...). The Available Tests view lists the batches you can use, and lets you define your own. - If the project supports several platforms, pick one.
- Choose the parameters:
- Manual tuning: write the parameters to try, as JSON. Click the examples (simple-combinations, list-of-combinations, 1x2 matrix...) to get started. Choose All combinations (a grid) or Sampling a number of them. The total number of runs is shown before you send.
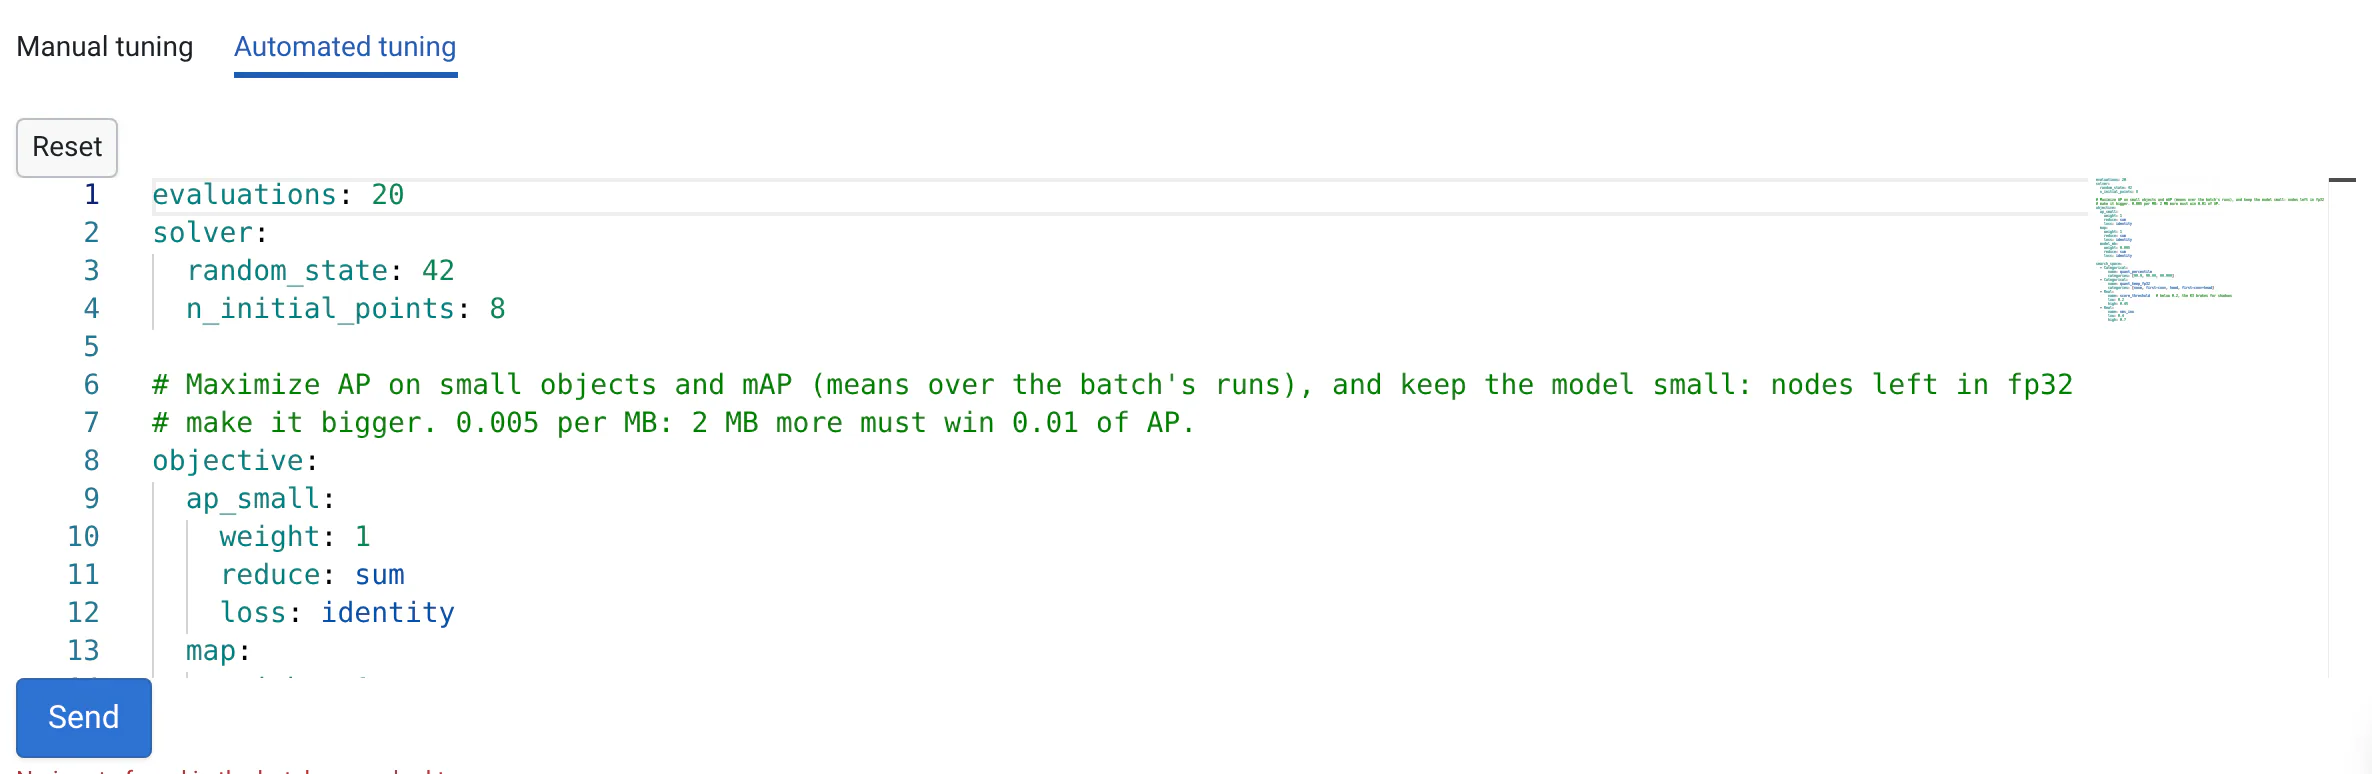
- Automated tuning: describe the search space and the objective in YAML, and let the optimizer (scikit-optimize) choose the parameters. It needs the project to compute metrics.
- To just run the tests, without tuning, use the no tuning example.
- Send. The runs start as you (the "Will run as" tag), and a message confirms the request.
Then select the new batch in the batch selector to follow it. When it's done:
- compare it with the CI batch (see the tip in Comparing results),
- open the Analysis view to see how metrics depend on the parameters, and the best parameters found by an automated tuning.
Batches started from QA-Board are listed in the Logs view with the command QA-Board ran and its logs:
Turn on Overwrite previous identical runs to redo runs that already exist with the same input, configuration and parameters. Otherwise they are kept and not run again.
For a video walkthrough and how a project enables it, see Tuning from QA-Board. For the batch syntax, see Batches of inputs.
Integrations: CI jobs, links and webhooks
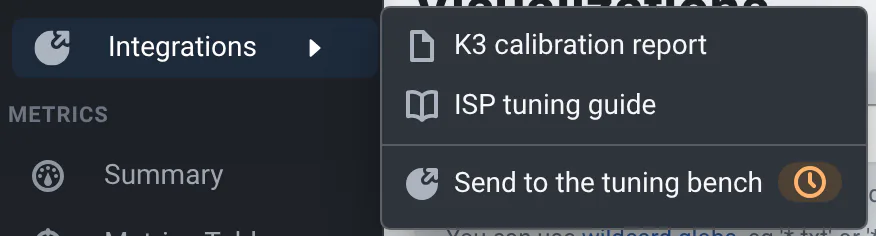
Projects can add buttons to the sidebar's Integrations menu (hover it to open). What you see depends on how your project is configured:
- Links to docs, dashboards, build artifacts or reports. A link is disabled when its target doesn't answer.
- Badges, like the pipeline status or the test coverage.
- GitHub Actions workflows, GitLab CI manual jobs and Jenkins builds: click to start them for this commit. A status tag shows whether the job is pending, running, successful or failed; click the tag to open the job's page and its logs. Once started, the icon changes to repeat so you can start it again. You need to be logged in to start GitHub Actions workflows and GitLab CI jobs.
- GitHub Actions workflows show the status of their latest run for the commit. GitHub runs them on the latest commit of the branch (or on the
refthe project chose), not necessarily on the commit you're looking at; QA-Board then follows the run you started. Only the workflows declared in the project's qaboard.yaml can be seen and started. - If the project configured nothing, the menu shows its git host's defaults on branch pages: GitLab's pipeline status, or a link to GitHub Actions. Badges that don't load are hidden.
- Webhooks that call other tools, with a tag showing the response.
Good to know:
- On the commit list, integrations act on the branch you're looking at. On a commit page, on the selected commit and batch.
- Statuses refresh every few seconds while the menu is open, and your browser remembers the jobs you started on each commit.
- With many entries, a search box appears at the top of the menu.
- Some projects show their most used integrations directly in the sidebar, outside the menu.
Project integration: see Triggering external tools to configure integrations.
Logs
- Each run's log is in the Logs view (Show logs), and updates live while the run is pending.
- The Batch logs at the bottom list the commands that started the batch, by whom and where, with an Open Logs link to the cluster or CI job.
- For CI jobs started from Integrations, click their status tag to open the job's own logs.