Find the best parameters automatically
When a few parameters need tuning and there's no time to try every combination, an automated tuning searches them for you. It runs a batch with some parameters, looks at the metrics, picks parameters that look better, and repeats. You say what to tune and what "better" means; QA-Board shows what it found, how sure it is, and what to do next.
- The project lets people start runs from the web app: the commit page's sidebar has Run Tests / Tuning, under Tuning. If it doesn't, see Let people tune from the web app.
- Your code reads tuning parameters, like for a grid search: see how parameters reach your code.
- Your runs return the metrics to improve. There is nothing to declare first: the form lists the metrics of the commit's runs, and you say whether higher or lower is better.
Start an automated tuning
On the detector, the int8 model still lost AP on small objects against fp32 after a better calibration. To find which quantization and post-processing settings get it back, without a model that grows too much:
- On the commit page of the code to tune, select Run Tests / Tuning in the sidebar, under Tuning.
- Give the experiment a Batch label, like
tune-int8, and choose the Batch of inputs+configurations to run at each evaluation:quant-search, the slices where quantization hurts most. The form says how many tests it has. - Open the Automated tuning tab. Under 1 Parameters to tune, click Add a parameter for each value your code reads: its name, its kind (Number, Whole number or Choice), and the range or the values to try.
- Under 2 What “better” means, pick the metrics to improve, and for each whether Higher is better or Lower is better. When your project's code declares it, the form fills it in.
- Under 3 Budget, set the number of Evaluations: the form recommends one for your number of parameters.
- When the summary on the right says Ready to start, click Start automated tuning.
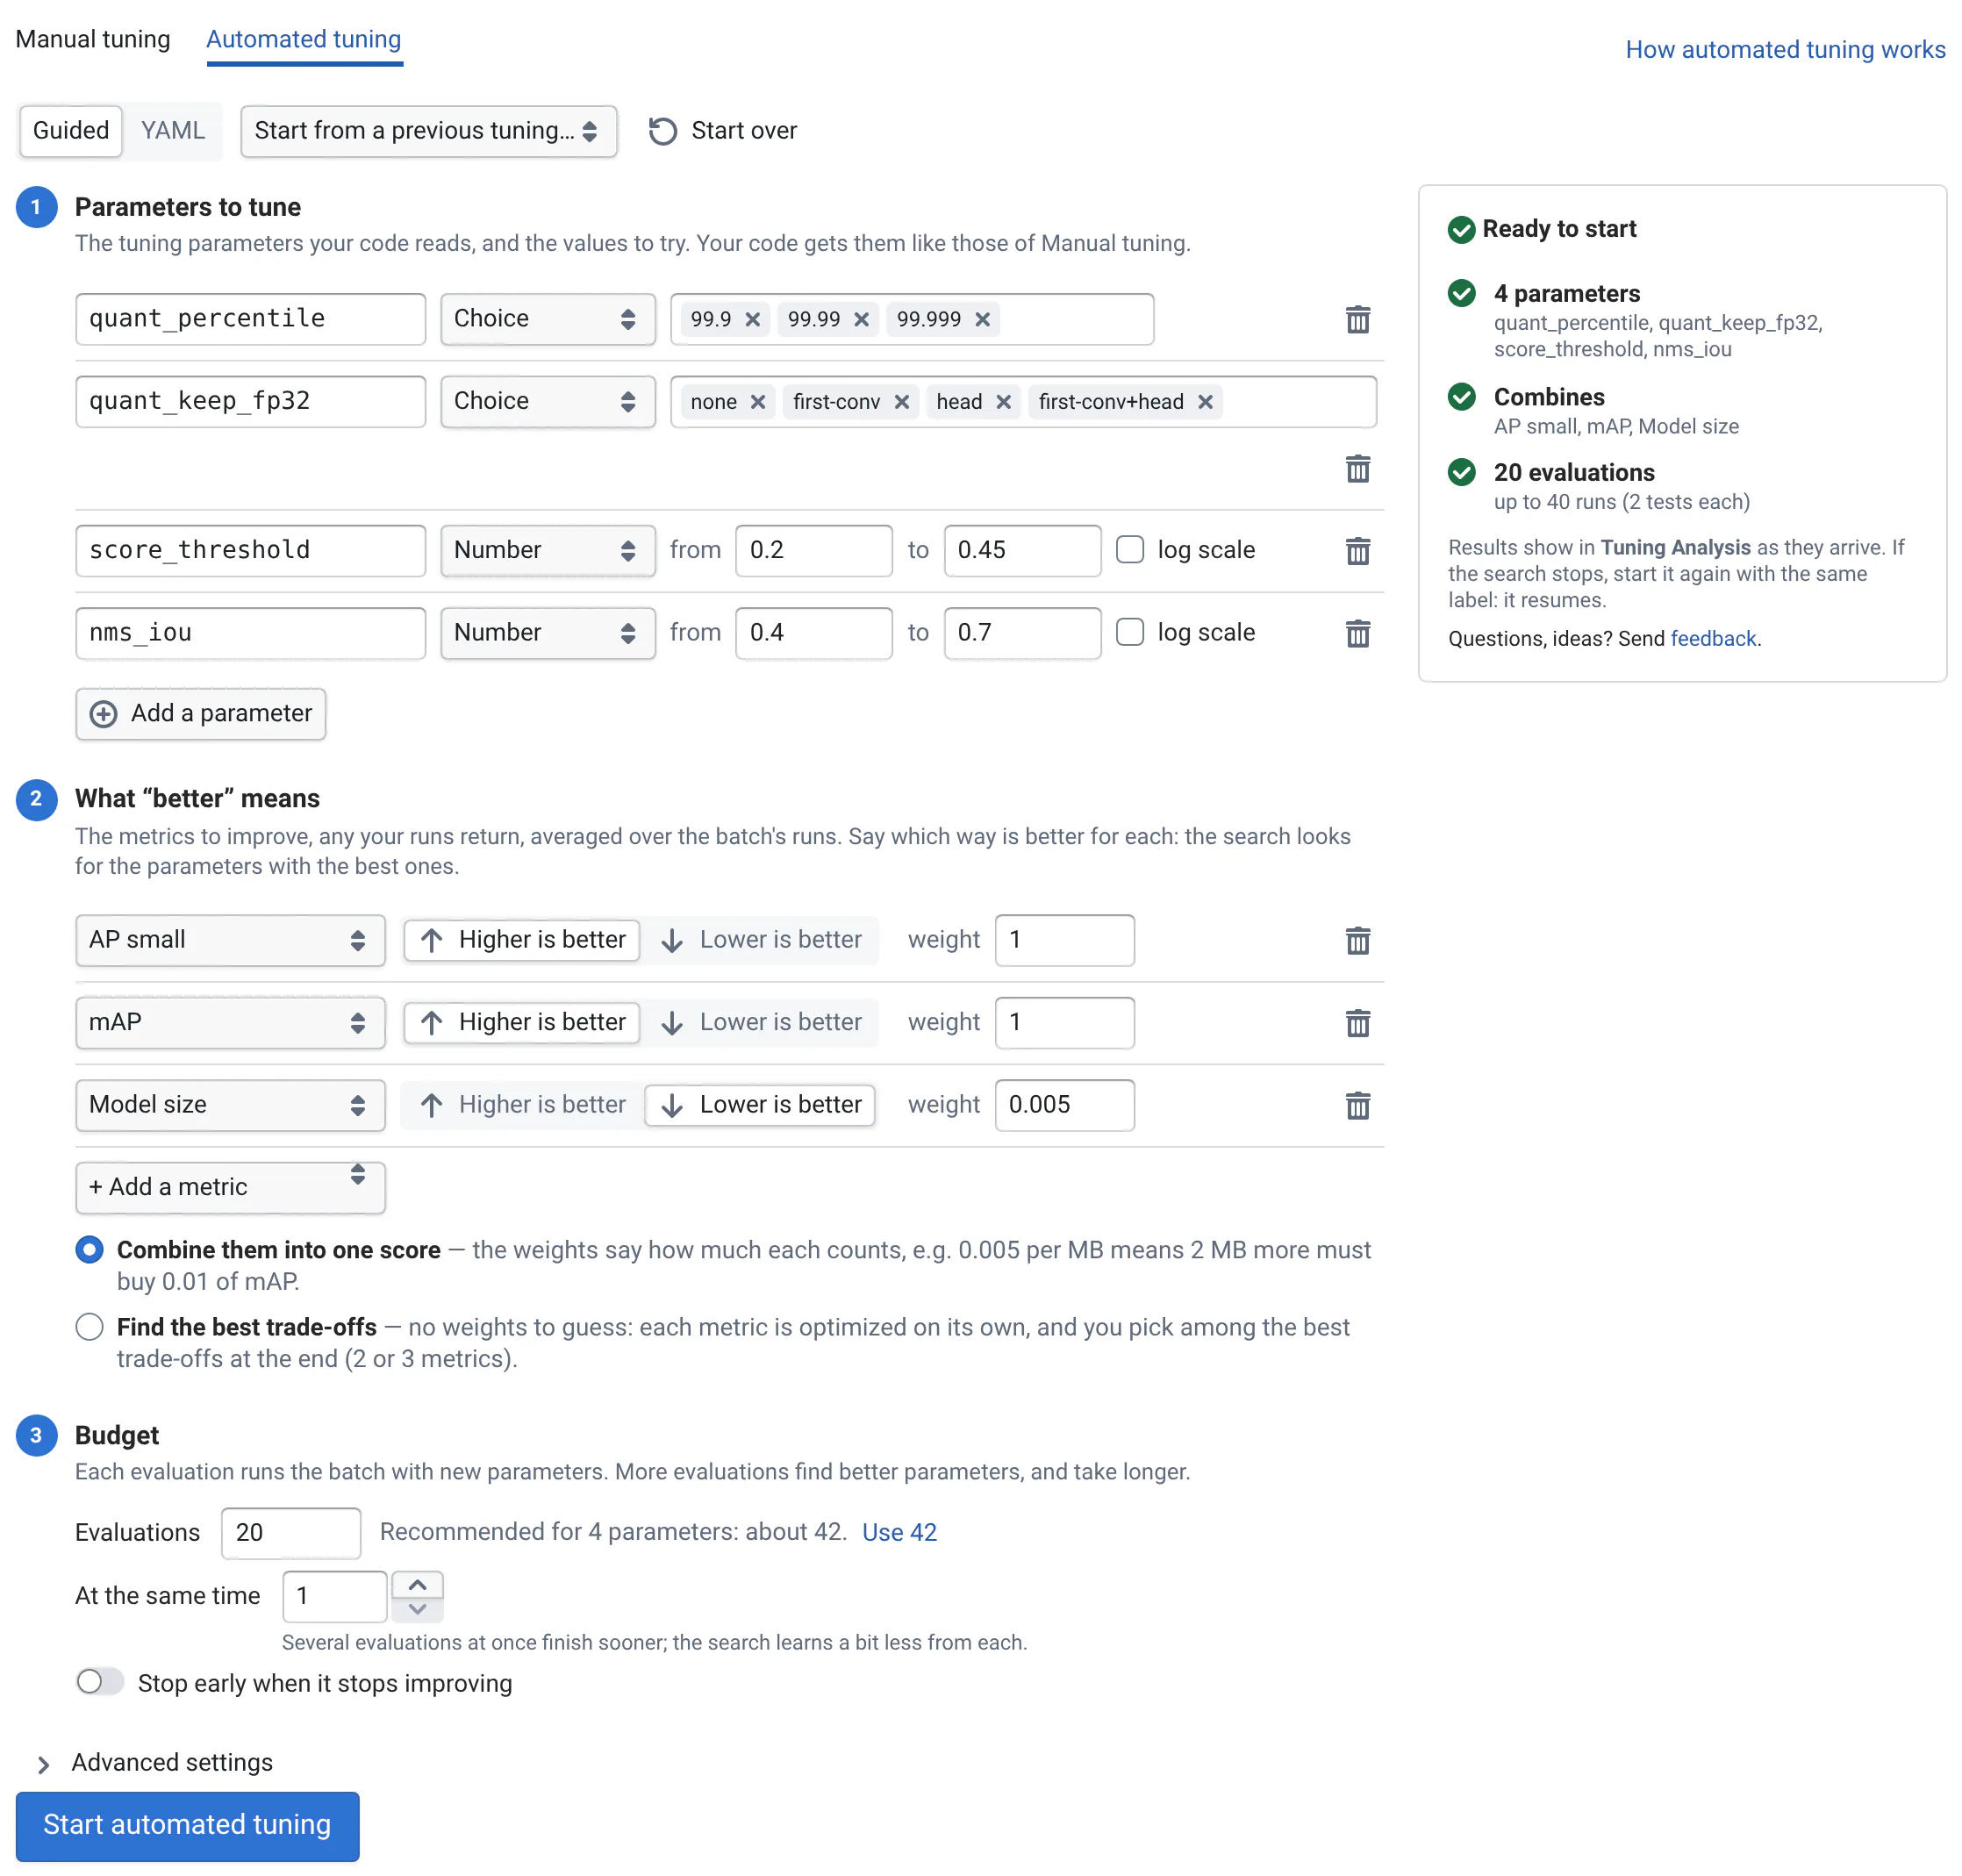
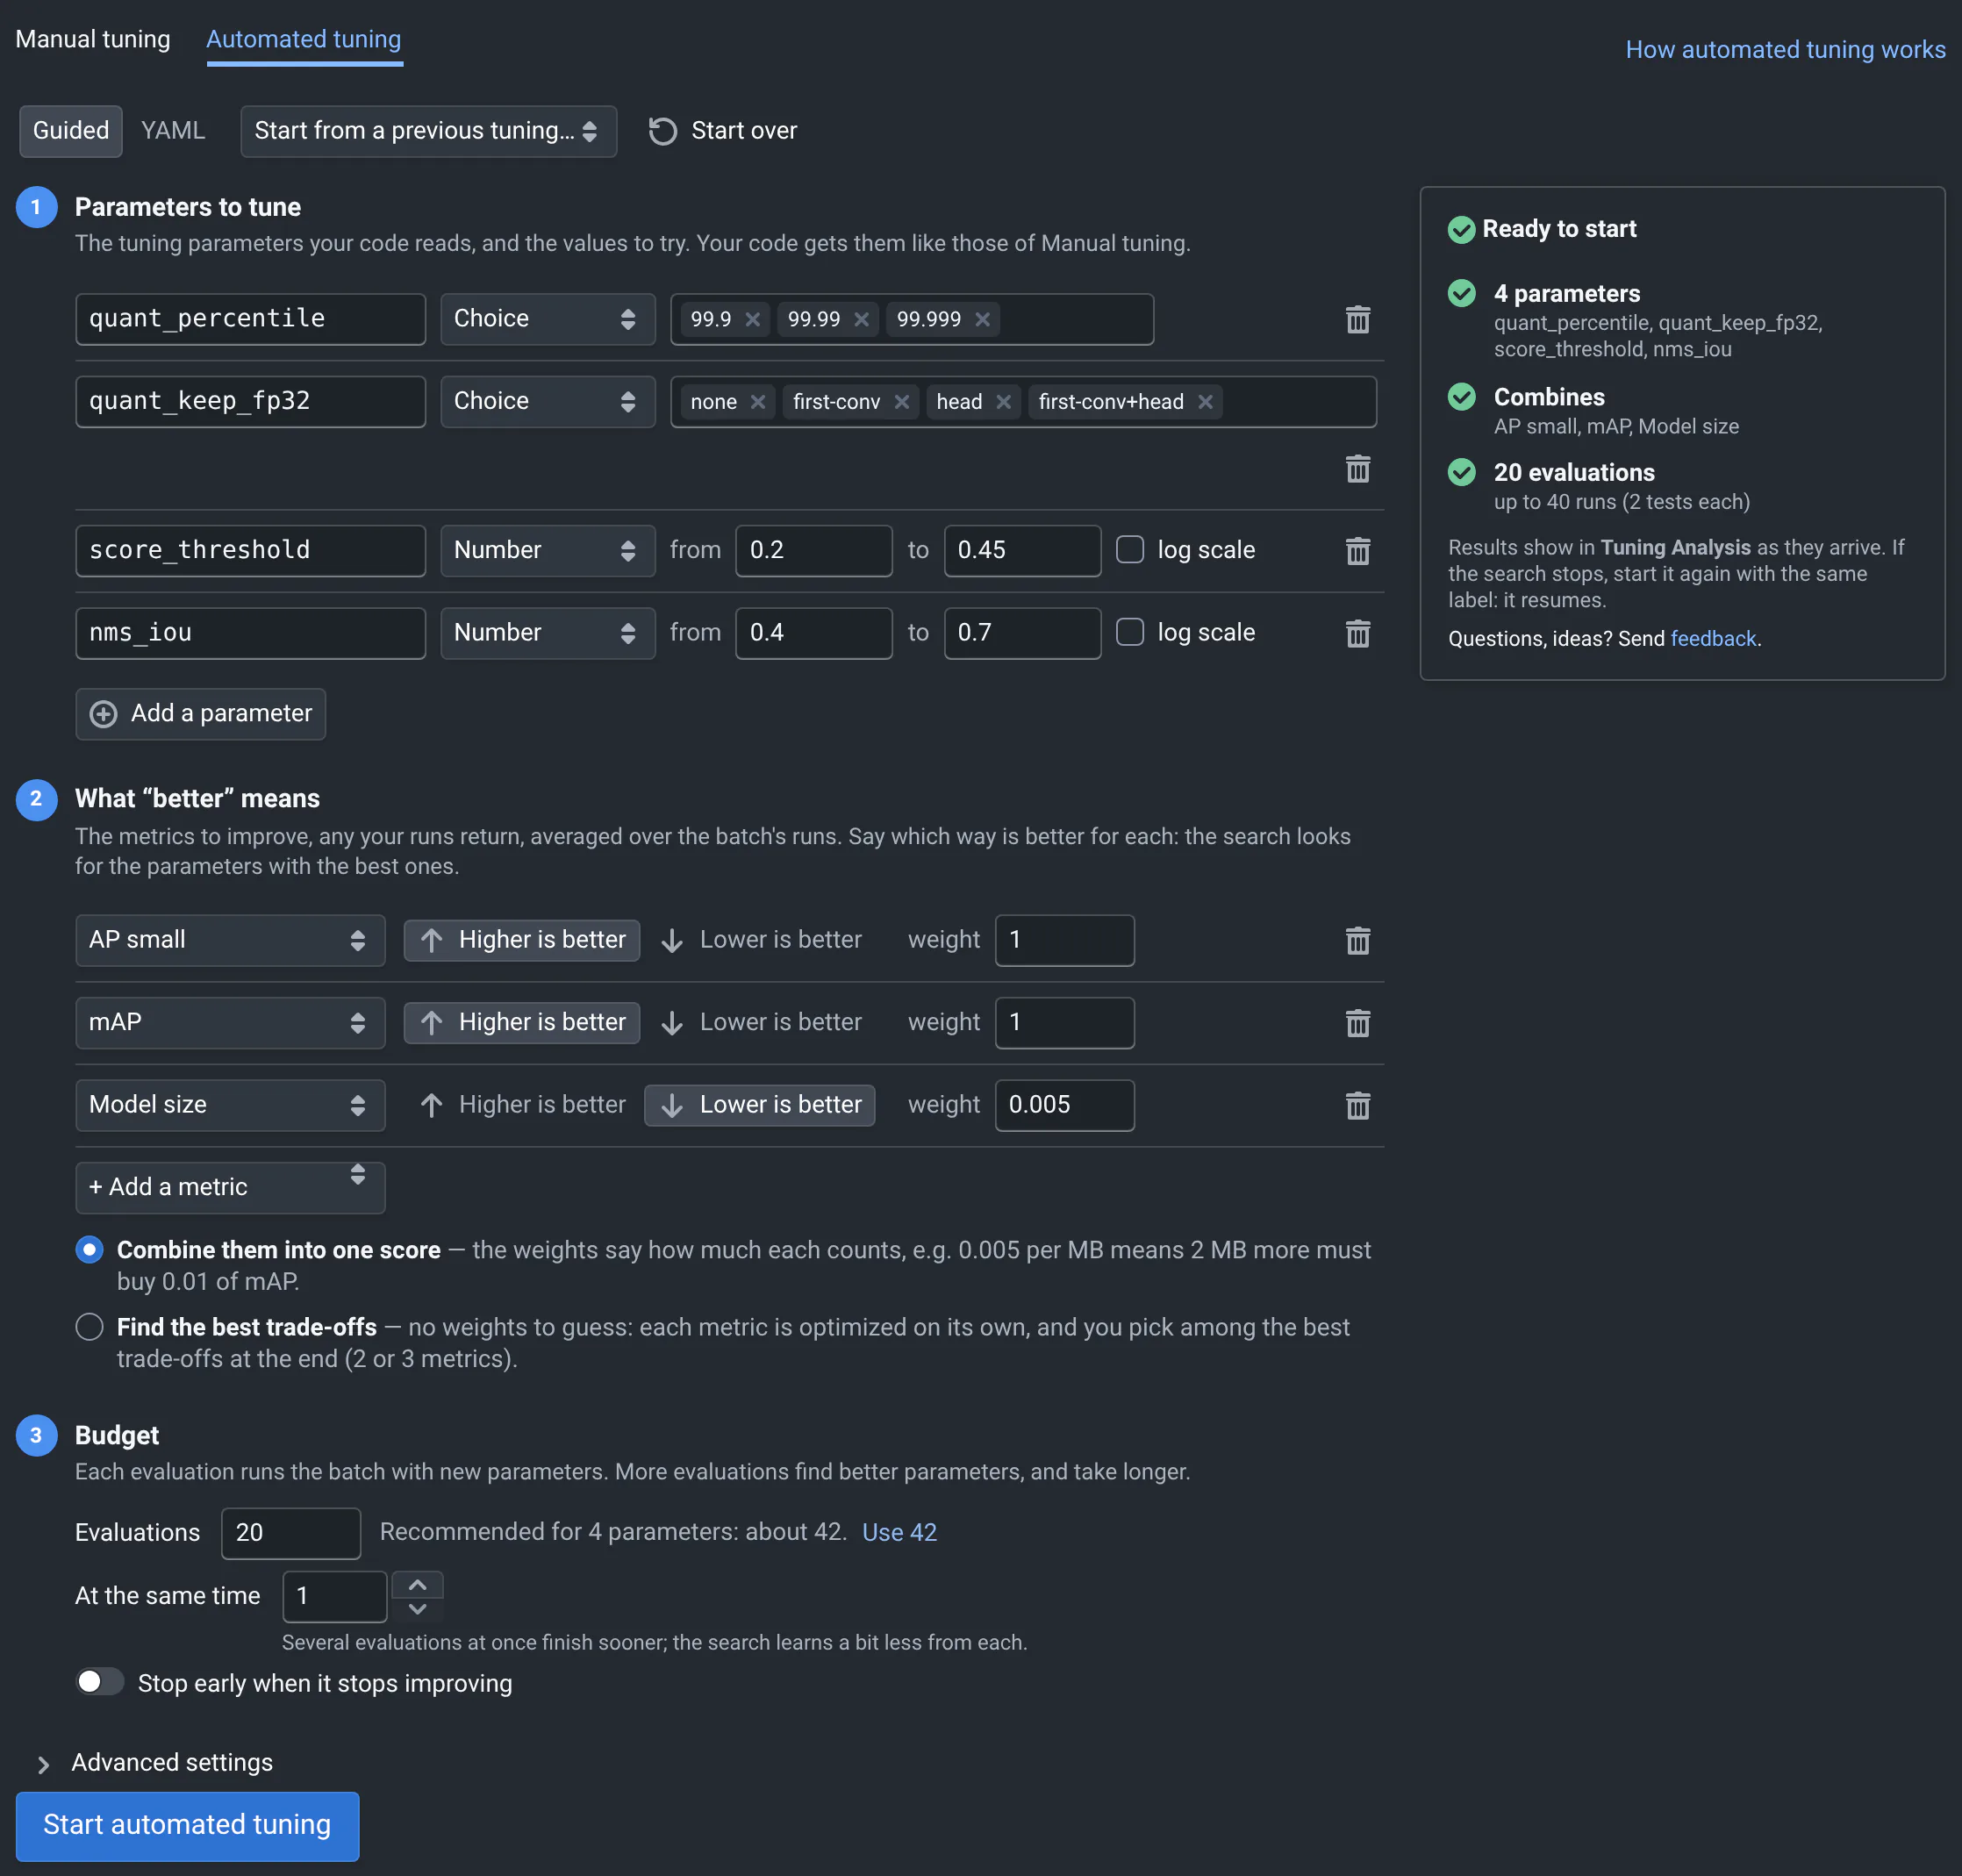
Each evaluation runs the whole batch with new parameters, under the label tune-int8|iterN. The results show in
Tuning Analysis as each evaluation ends: see Read the results.
The form edits a YAML configuration: the YAML button shows it, and you can edit it there too. Your comments in it are kept. Start from a previous tuning… copies the settings of an automated tuning of the same commit.
Choose the parameters, the goal and the budget
Good choices here matter more than any setting of the search.
What to tune
- Tune a few parameters, 2 to 6. Each one more needs more evaluations. If you already know a good value for one, don't tune it.
- Choose ranges you would accept, a bit wider than where you expect the best. If the best ends up at the edge of its range, the results say so, and you can widen it and go on.
- Number is for any value in a range, like a threshold. Whole number is for counts, like a number of iterations or a kernel size. Choice is for options without an order, like a solver or a calibration method.
- Log scale is for values that span orders of magnitude, like a learning rate between 0.00001 and 0.1: the search tries as many values between 0.001 and 0.01 as between 0.01 and 0.1. The form suggests it when a range covers a factor of 100 or more.
What “better” means
The metrics are averaged over the batch's runs: choose a batch that represents what you care about, and small enough to run many times.
With one metric, the search looks for its best value. With several, choose how to compare them:
- Combine them into one score: the weights say how much each counts. The detector's AP on small objects and mAP have a weight of 1, and the model size 0.005 per MB: 2 MB more must buy 0.01 of AP.
- Find the best trade-offs: when you can't say what a MB is worth. Each metric is optimized on its own, and at the end you pick among the best trade-offs, those that can't improve on one metric without losing on another (the Pareto front). For 2 or 3 metrics.
How many evaluations
- Evaluations: about 10 per parameter, a few more for choices with many values, and at least 20: the form recommends a number. The first ones try random parameters, to explore (10 by default). After that, each evaluation uses what the previous ones learned.
- Each evaluation runs the whole batch: 40 evaluations of a batch with 4 tests is up to 160 runs. The summary counts them.
- At the same time: several evaluations at once finish sooner, and the search learns a little less from each. 2 to 4 suit a cluster.
- Stop early when it stops improving: ends the search after that many evaluations in a row without a better result, before using the whole budget.
Read the results
- In the new bar's batch selector, pick the experiment's batch,
tune-int8. - Select Tuning Analysis in the sidebar: it's highlighted when the batch is an automated tuning.
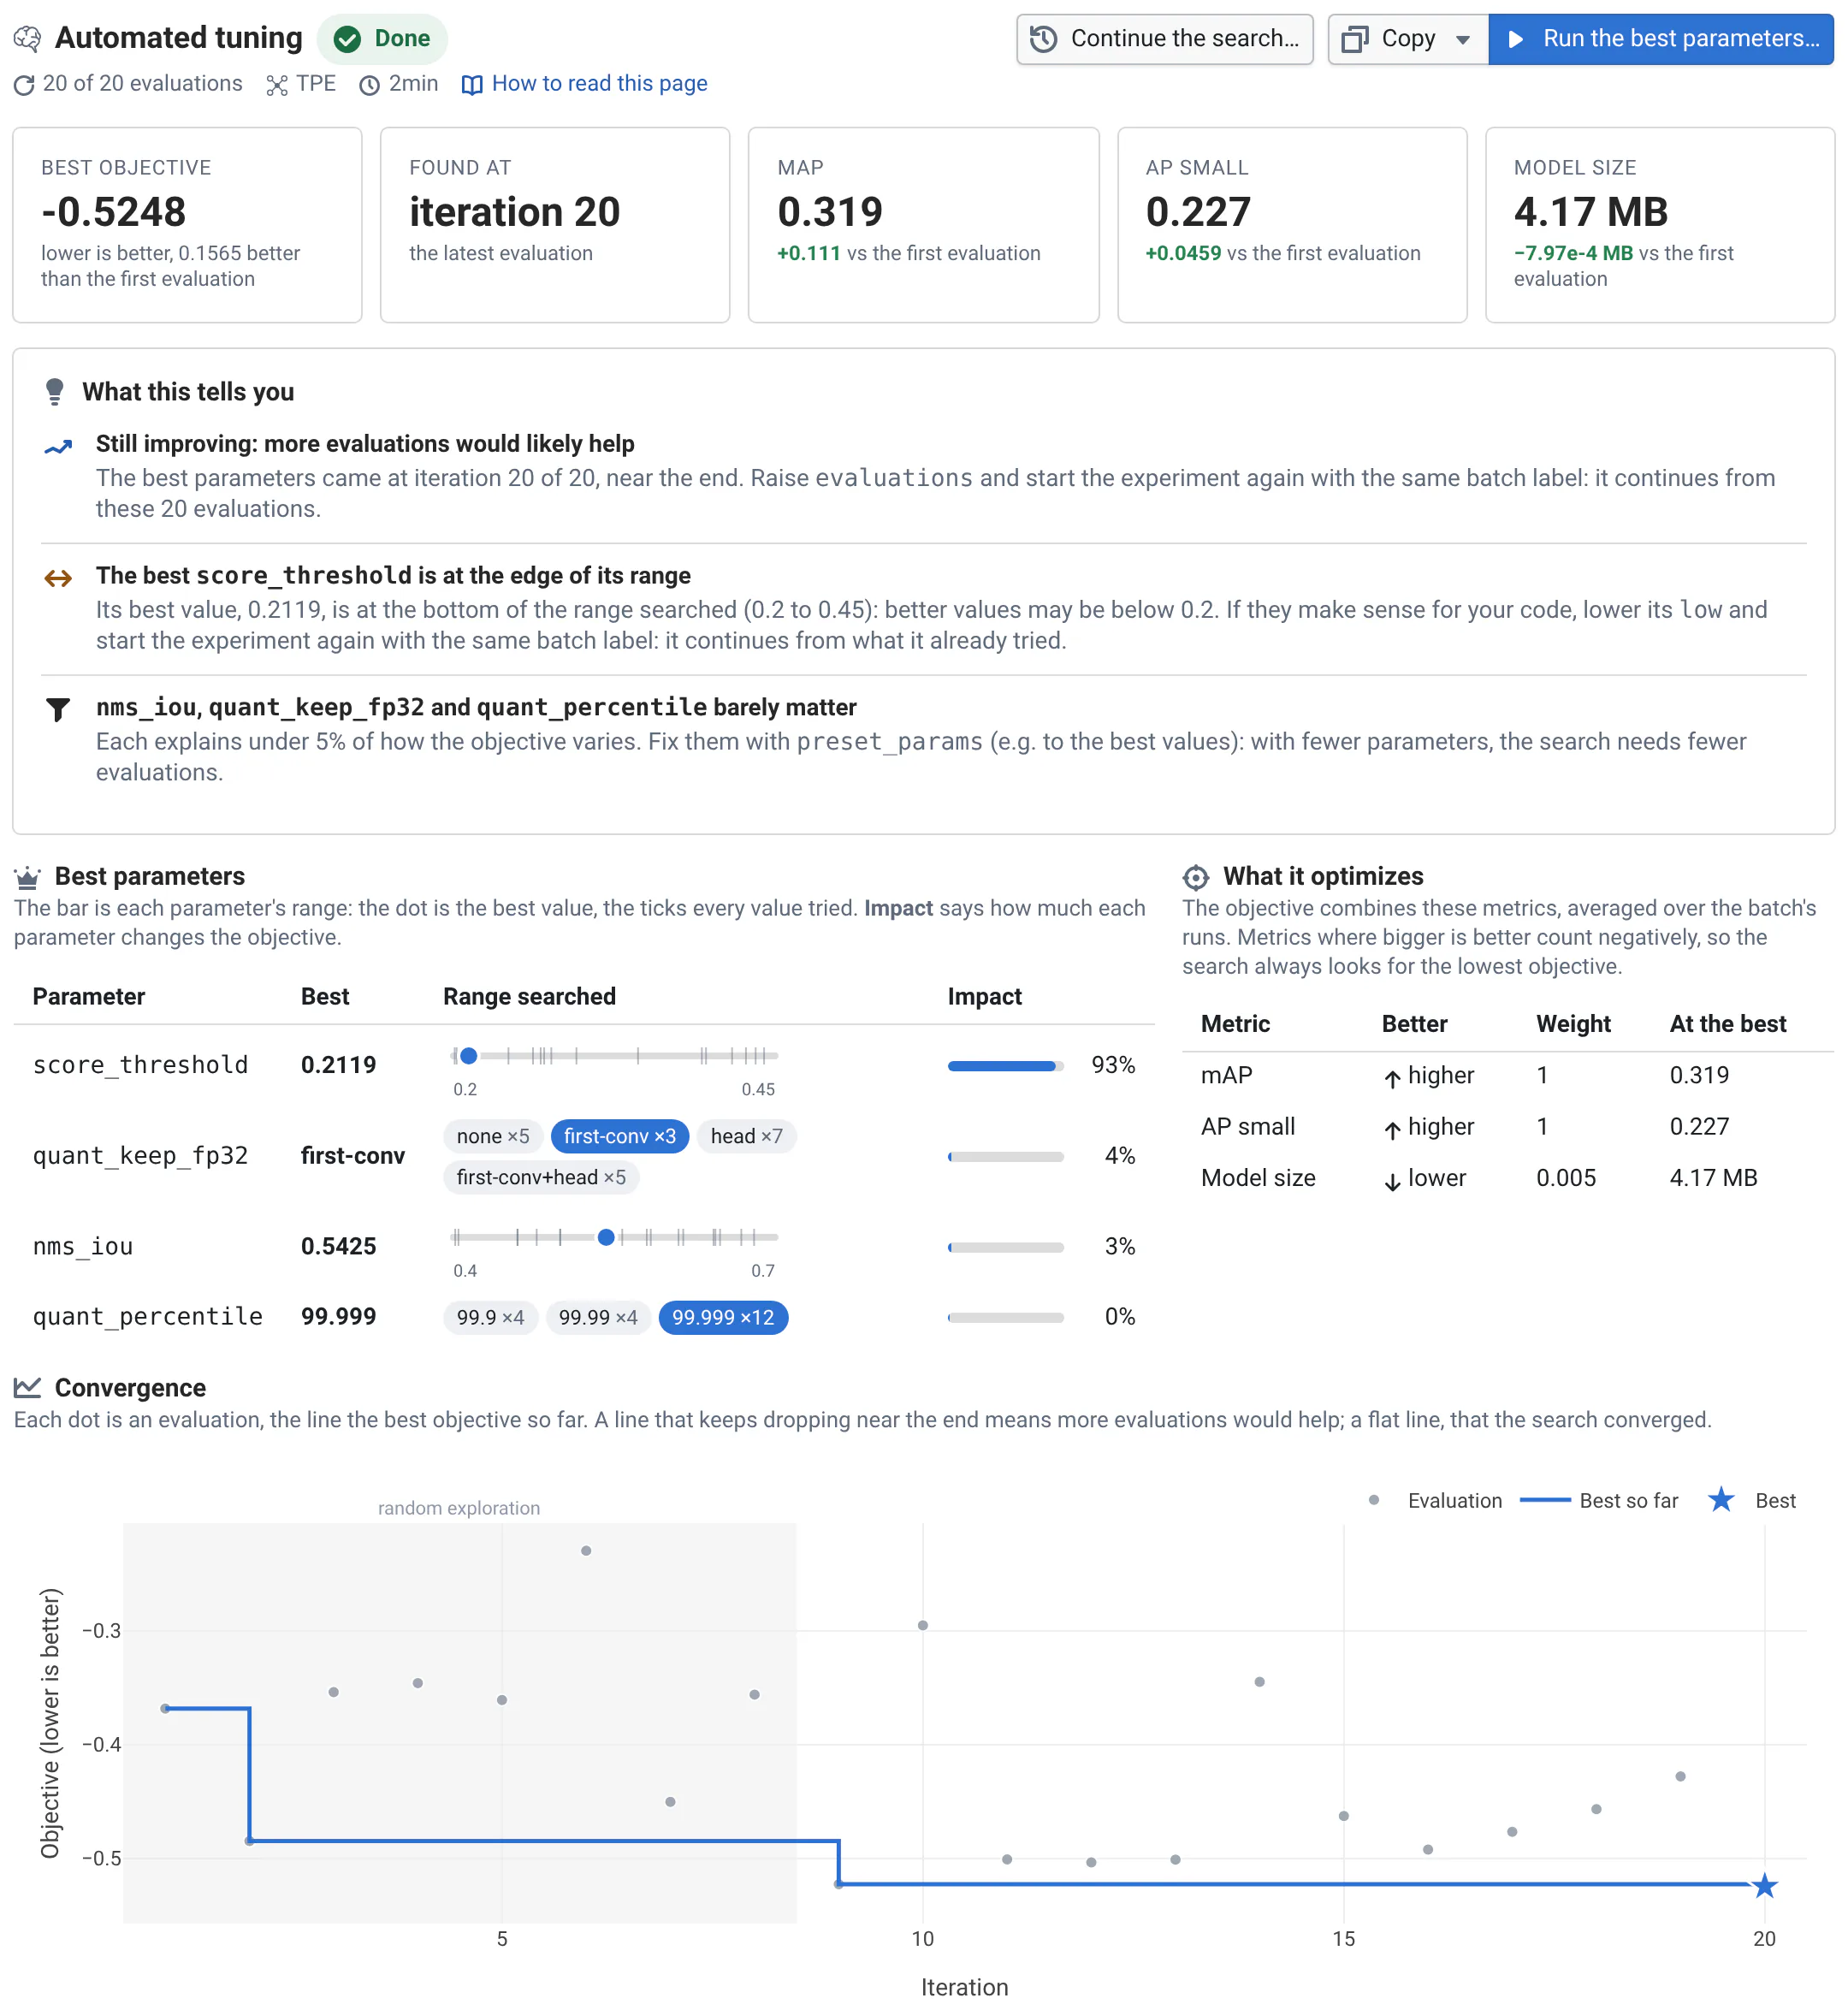
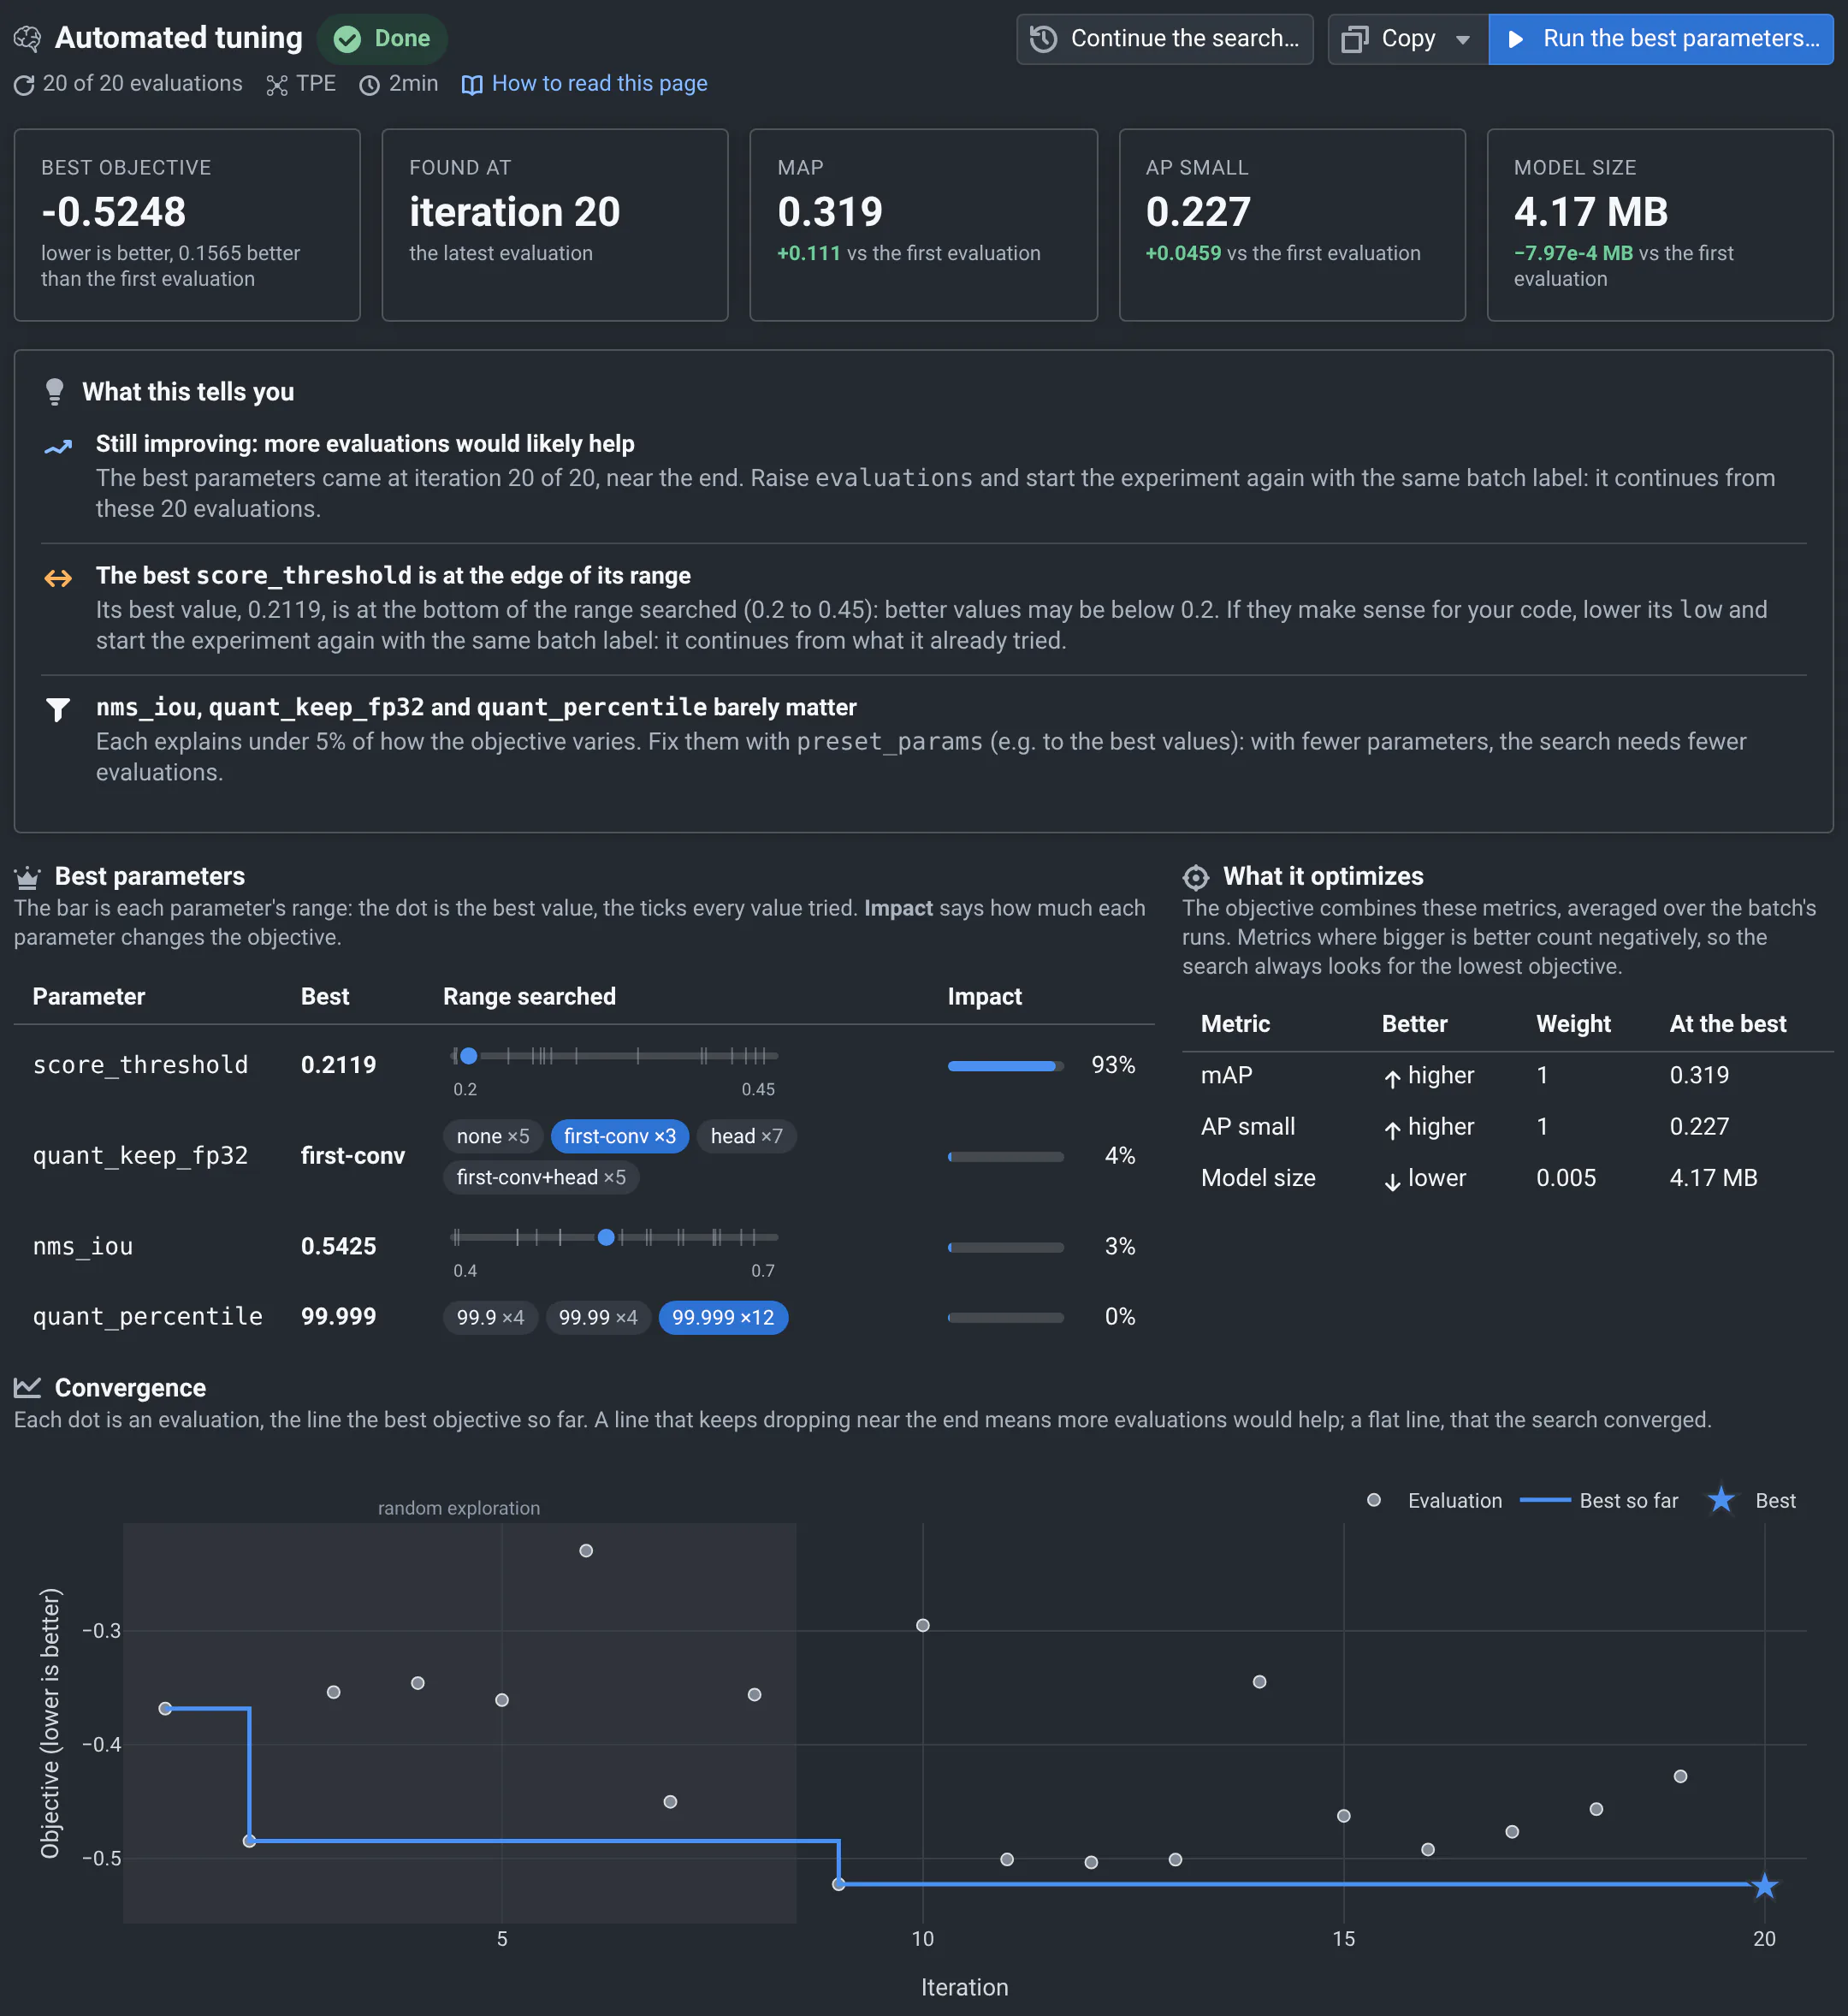
The page answers, from the top:
- Is it done? Running, Done, Stopped early or Interrupted, and how many evaluations of the budget ran. While it runs, the page refreshes by itself.
- What did it find? The best objective, the iteration that found it, and the metrics there, compared with the first evaluation. The objective combines the metrics into one number where lower is better: metrics where higher is better count negatively.
- What does it mean? What this tells you says whether more evaluations would help, which best values are at the edge of their range, which parameters barely matter and which evaluations failed, and what to do about each: see What to do next.
- Which parameters? Best parameters: each one's best value, the range searched with every value tried, and its Impact: how much it changes the objective.
- Why? Convergence: each evaluation's objective, and the best so far. The shaded part is the random exploration. How each parameter affects the objective: one plot per parameter, darker dots came later. A clear valley shows a good value, a flat cloud a parameter that doesn't matter much.
- All evaluations, in a table you can sort. More plots has the views of a grid search, like the parallel coordinates.
When the goal is the best trade-offs, the page starts with them instead: the Pareto front plotted on the two metrics, and each trade-off with its parameters.
What to do next
| The results say | What to do |
|---|---|
| Still improving | More evaluations would likely find better parameters: click Continue the search…, then Start automated tuning. |
| Improvements are slowing down or The search has likely converged | The best parameters are good to use. To refine them, narrow the ranges around the best values and continue. |
| The best … is at the edge of its range | Better values may be beyond it. If they make sense for your code, widen the range and continue. |
| … barely matters | Next time, fix it to its best value and tune the others: the search needs fewer evaluations. |
| N evaluations failed | Open the logs to see why. The search went on without them. |
To use the best parameters:
- Run the best parameters… opens Manual tuning with them filled in: run them on more tests, like the CI's batch, to check that they hold up.
- Copy them as
preset_params, to fix them in another tuning, or as JSON, forqa --tuning. - With the best trade-offs, each one has its own Run… button.
Continue or restart a search
An automated tuning saves its progress. Starting it again with the same batch label continues it, from the evaluations it already did:
- Continue the search… opens the form with the same settings and label, and more evaluations.
- When you reuse a label, the form says the tuning continues, and starts only once there are more evaluations than already done.
- When continuing, you can widen or narrow ranges and add parameters. If you change what "better" means, use another label: the past evaluations can't be compared with new ones.
- If a search was interrupted, start it again with the same label and settings: it picks up where it stopped.
Questions
Why does the search still try poor parameters near the end? It keeps exploring a little, in case better values hide elsewhere. The best so far is what counts.
Does the same tuning find the same parameters twice? With the same settings and seed (in Advanced settings), and one evaluation at a time, it tries the same parameters as long as the metrics are the same. Evaluations at the same time end in a different order each time, and runs that aren't deterministic give other metrics: then the search takes another path.
How does it pick the next parameters? It models how the metrics change with the parameters, from the evaluations so far, and tries where the model expects better results. Advanced settings has the method: see Automated tuning with qa optimize for each one.
The metric I want isn't in the list. The list has the metrics the project declares and those the commit's runs returned. Choose Another metric… and type its key, as your code returns it.
Can the project say once which way is better? Yes: where the code computes the metric, with
qaboard.Metric(value, smaller_is_better=False) or define_metric (see
declaring metrics). The form then fills it in, and the
tables and plots of the web app color its changes.
Does QA-Board email me when it ends? Not for automated tuning yet.
- Project integrationAutomated tuning with qa optimizeEvery setting, the command line, and how the objective is computed.
- Running from the web appGrids of parameters, and the plots that compare them.