The commit page
The commit page shows the results of one commit (the new one) compared with a reference. Its URL looks like /<project>/commit/<hash>?reference=<hash>&batch=....
The top bars
There are two bars, new on top and ref below. Each one shows:
- The commit message, its author and date.
- A star to save the commit as a milestone.
- The commit hash field: type another hash to switch commits, or hover Change for more options (switch new and reference, pick a branch or a milestone...). See Picking a reference.
- The branch: click it to select the latest commit of that branch.
- A filter box and the counters of runs (outputs, running, pending, crashed). See the filter syntax.
- The batch selector (see Batches).
- A refresh button, and a menu (☰) with:
- Commit: copy the commit's artifacts directory (Windows or Linux path), view it in the browser.
- Batch: copy the batch's output directory, view it in the browser, move runs to another batch, rename the batch, redo failed, deleted or all runs, and delete runs (all, failed only, or several batches at once). The Delete files, keep metadata switch deletes only the files, optionally matching patterns like
*.png. Milestones are protected from deletion.
The reference bar is hidden on the Logs, Available Tests and Run Tests / Tuning views: they only concern the new commit.
Above the views, messages tell you about the selected batch:
- N running / N pending: hover to list the runs. A Stop runs button cancels them.
- N crashed: the list of failed runs. Read their logs.
- N of the outputs below were deleted: Redo Deleted Outputs runs them again.
- Be careful, those are local outputs: the runs were started from someone's workspace, and may not match the committed code.
- This commit's artifacts have been deleted: Restore Artifacts brings them back (you'll likely need to rebuild to redo runs).
While runs are pending, the page refreshes by itself every 15 seconds.
The controls panel
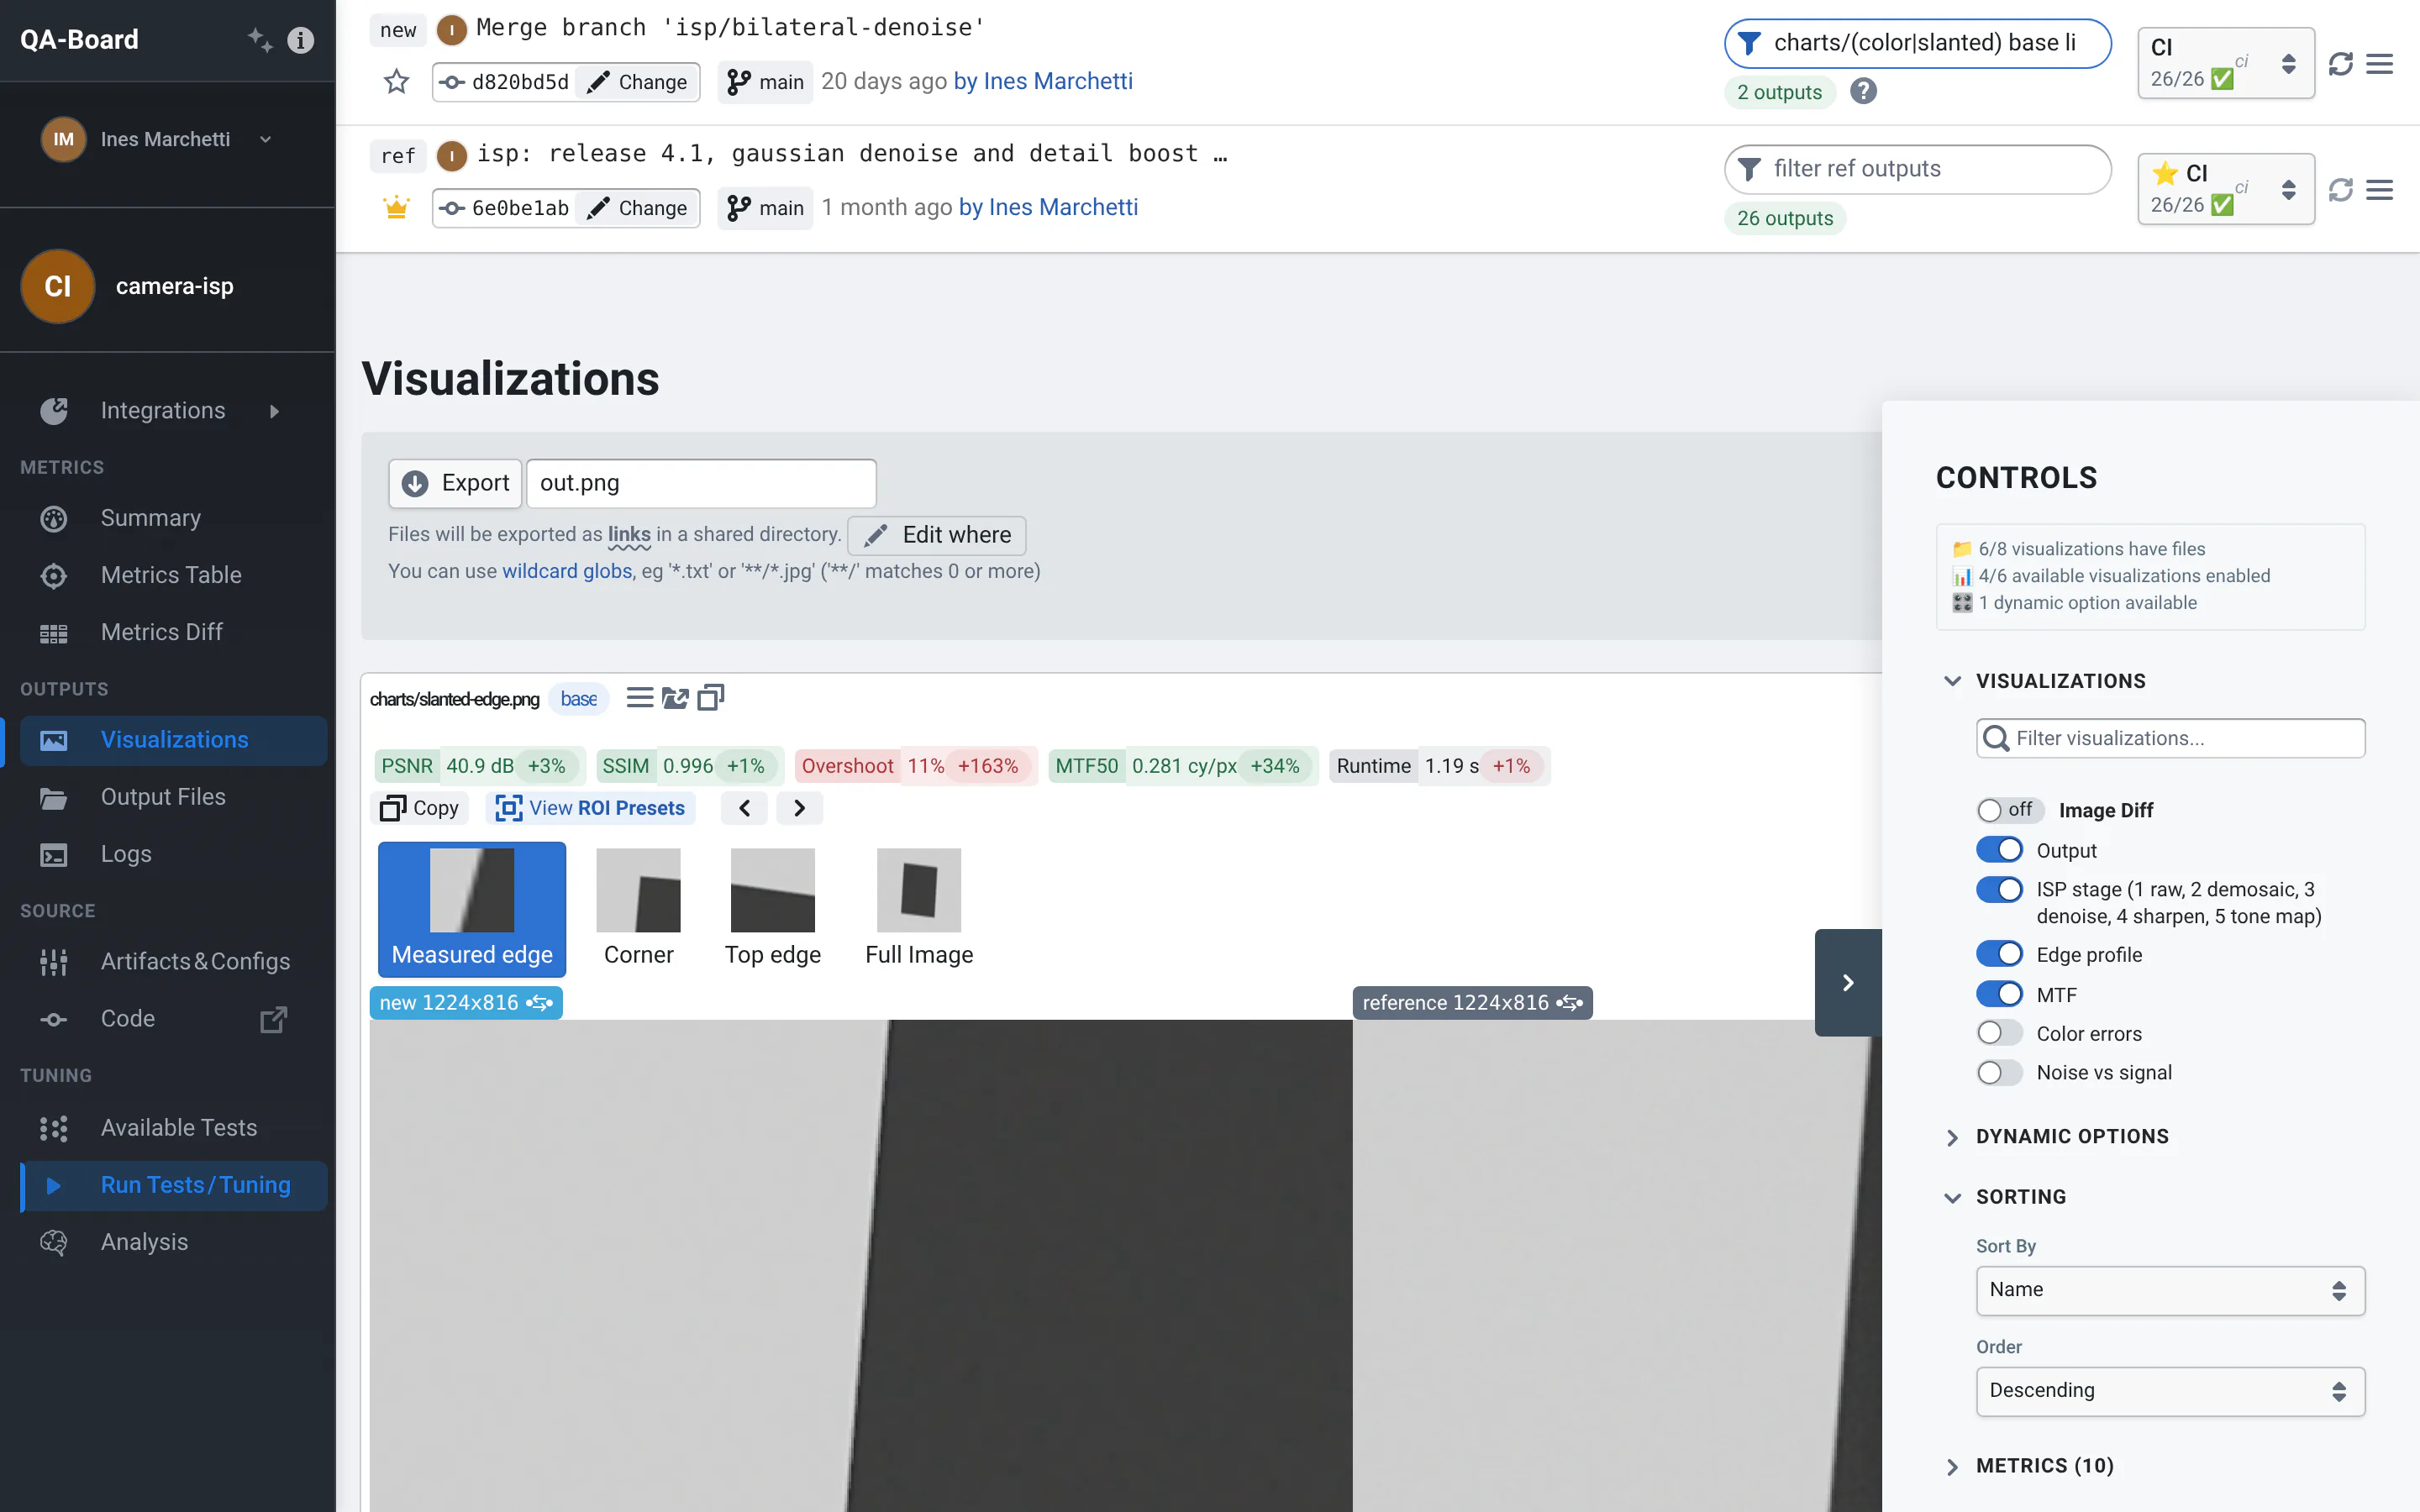
On the right edge of the page, the Controls panel (click the dark tab to open or close it, your choice is remembered):
- Visualizations: switches to show or hide each visualization, including the ones hidden by default, and Image Diff to show a perceptual difference between new and reference images. A search box appears when there are many.
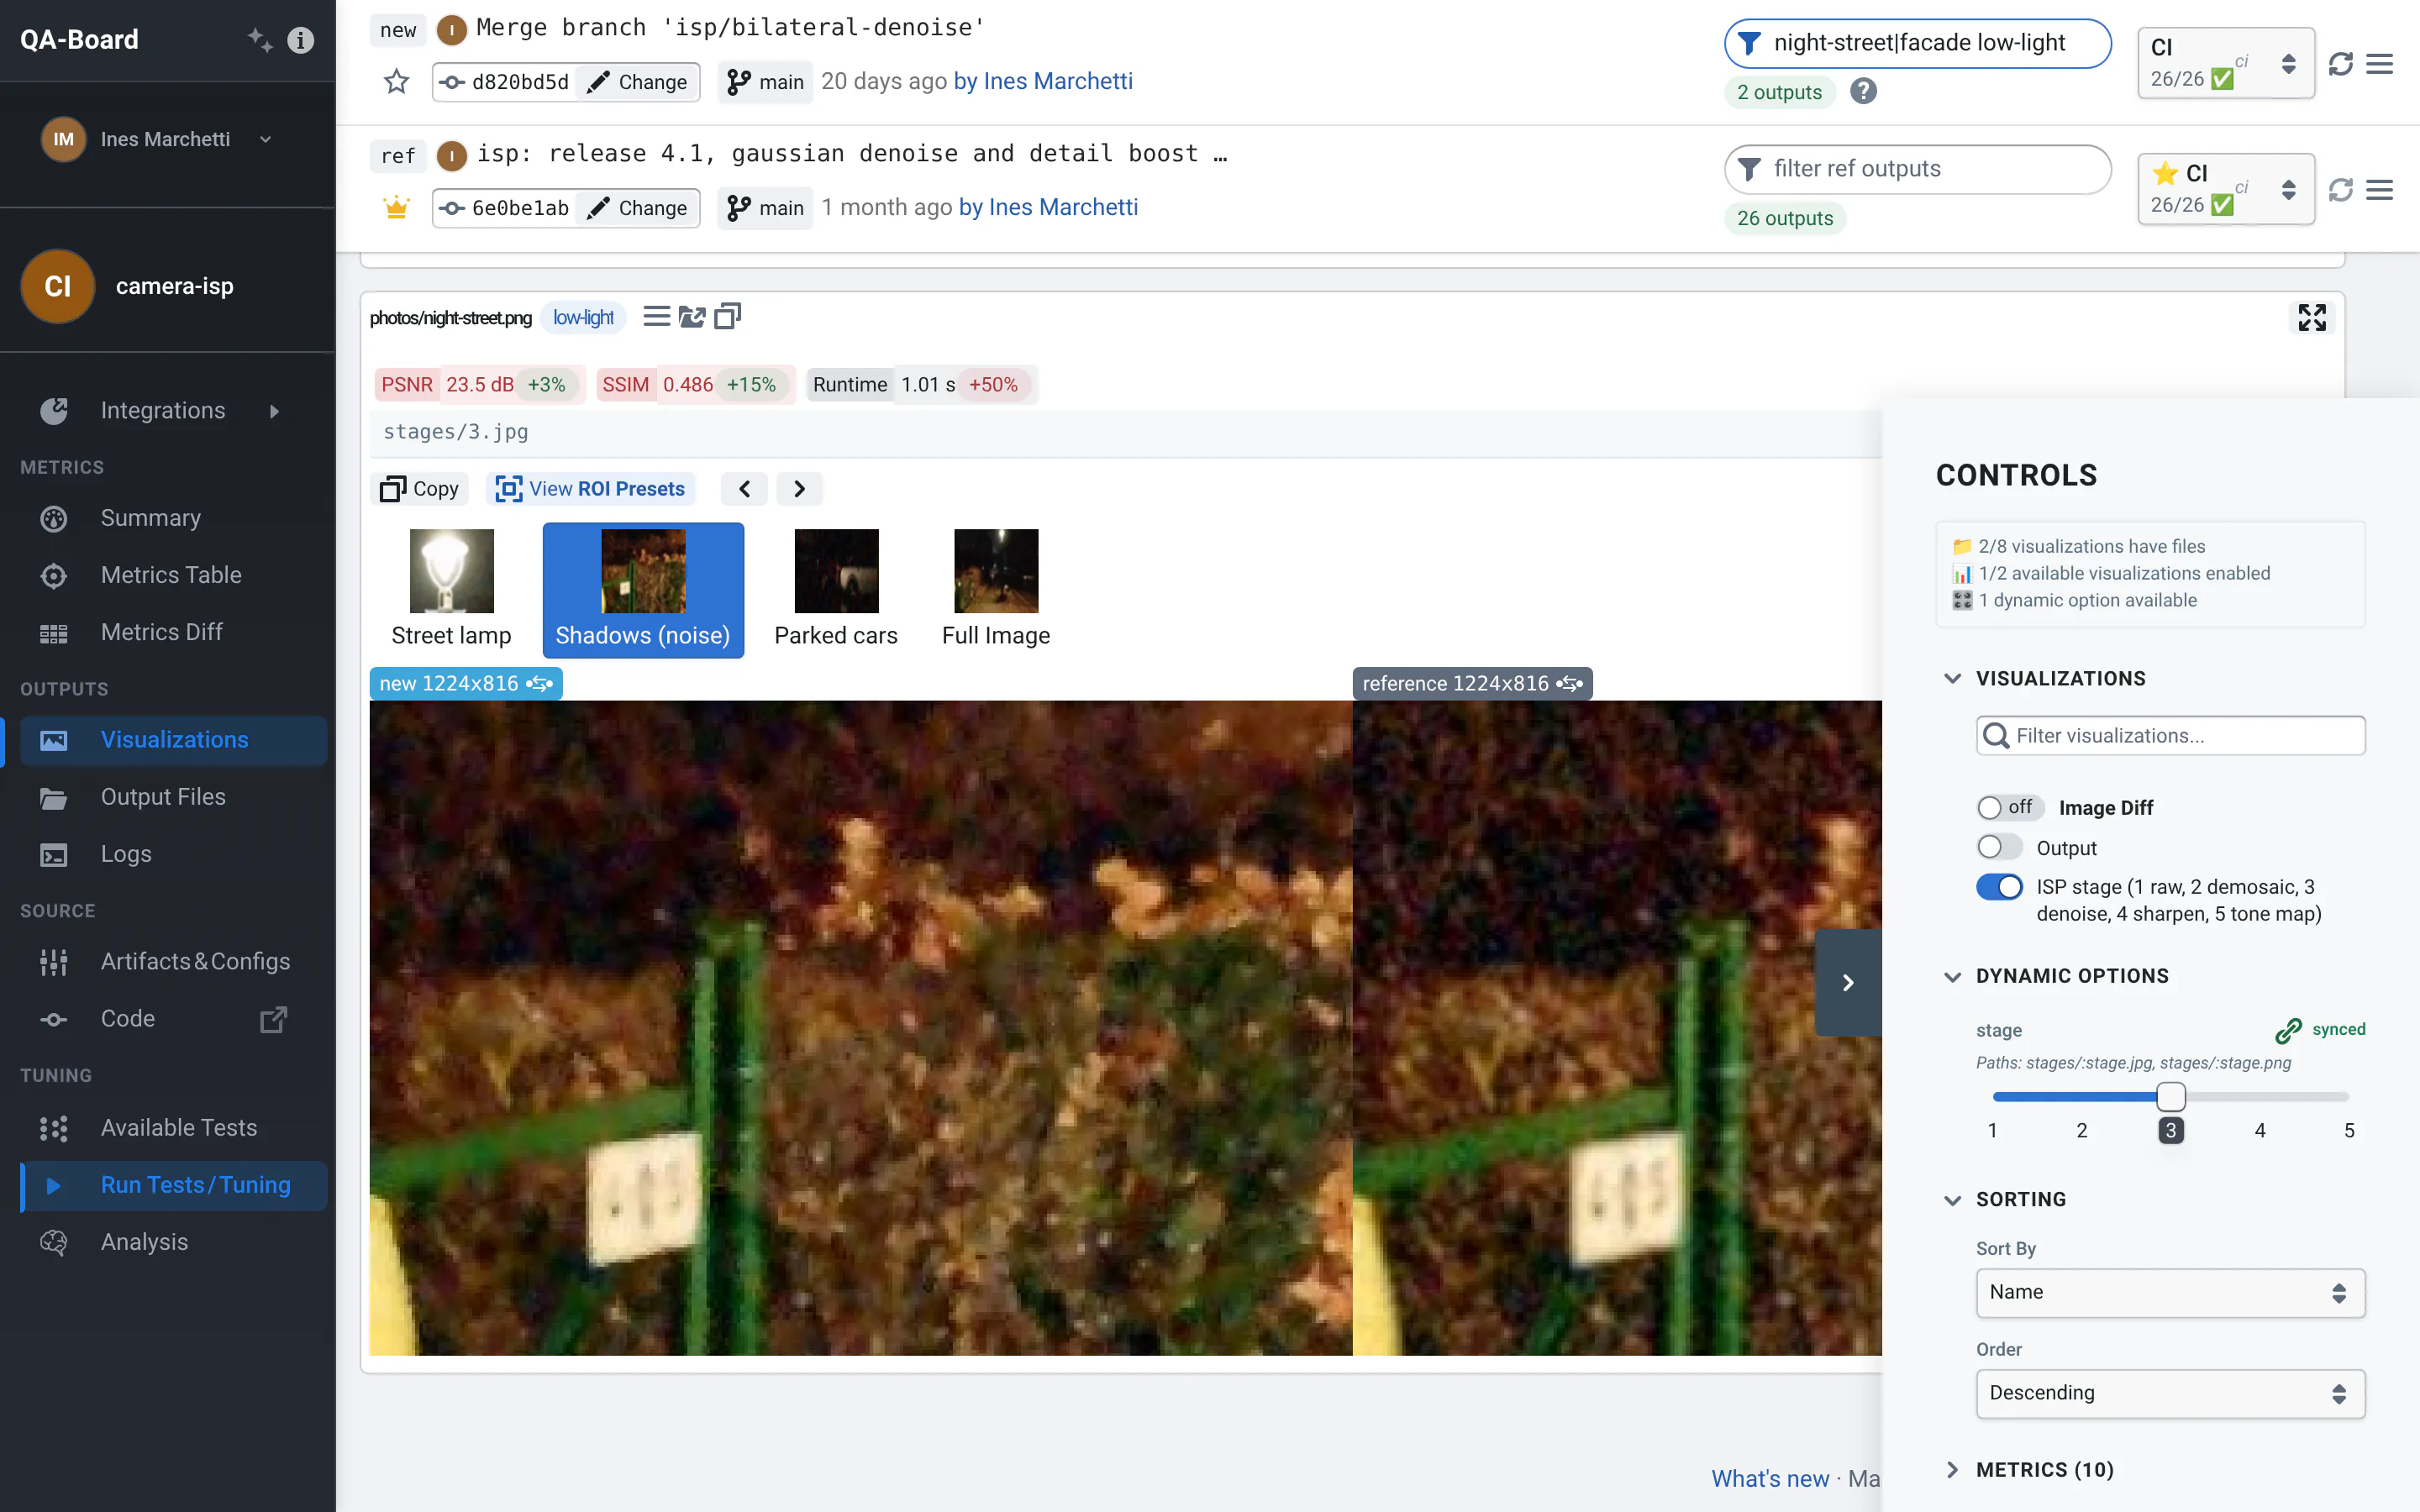
- Dynamic Options: when a visualization has several files per run (frames, channels, reports...), pick which one to show. Options are linked across all runs: the panel lists the values of all runs, and a run that doesn't have the selected value shows the closest one, with a note on its card. The link icon makes an option per-output: each card gets its own selector, starting from the linked value. Changing an option keeps the image viewers' zoom and selected region.
- Sorting: sort runs by name, id, storage, a tuning parameter or a metric, ascending or descending. It applies to tables and cards.
- Metrics: which metrics to show in the tables.
- Visualizations
- Image Diff
- Sorting
Views
The sidebar of a commit page lists the views. Each one answers a different question.
| Sidebar | View | Use it to... |
|---|---|---|
| Summary | Summary | Get the big picture: how the main metrics changed |
| Metrics Table | Quality report | Check each run's metrics against their targets |
| Metrics Diff | Improvement report | See per-run improvements and regressions vs the reference |
| Visualizations | Visualizations | Look at images, plots, videos, text... side by side with the reference |
| Output Files | Output Files | Browse and diff all the files each run created |
| Logs | Logs | Read why a run crashed, see the commands that started the batch |
| Artifacts & Configs | Artifacts & Configurations | Diff the build and the configuration files between commits |
| Code | Open the commit's code on your git server | |
| Available Tests | Available Tests | See, check and edit the batches of inputs you can run |
| Run Tests / Tuning | Tuning Experiments | Start new runs or tuning experiments on this commit |
| Analysis | Auto-Tuning Analysis | Understand the results of a tuning experiment |
Some projects open a different view by default. The selected view is part of the URL (selected_views=), see Sharing.
Summary
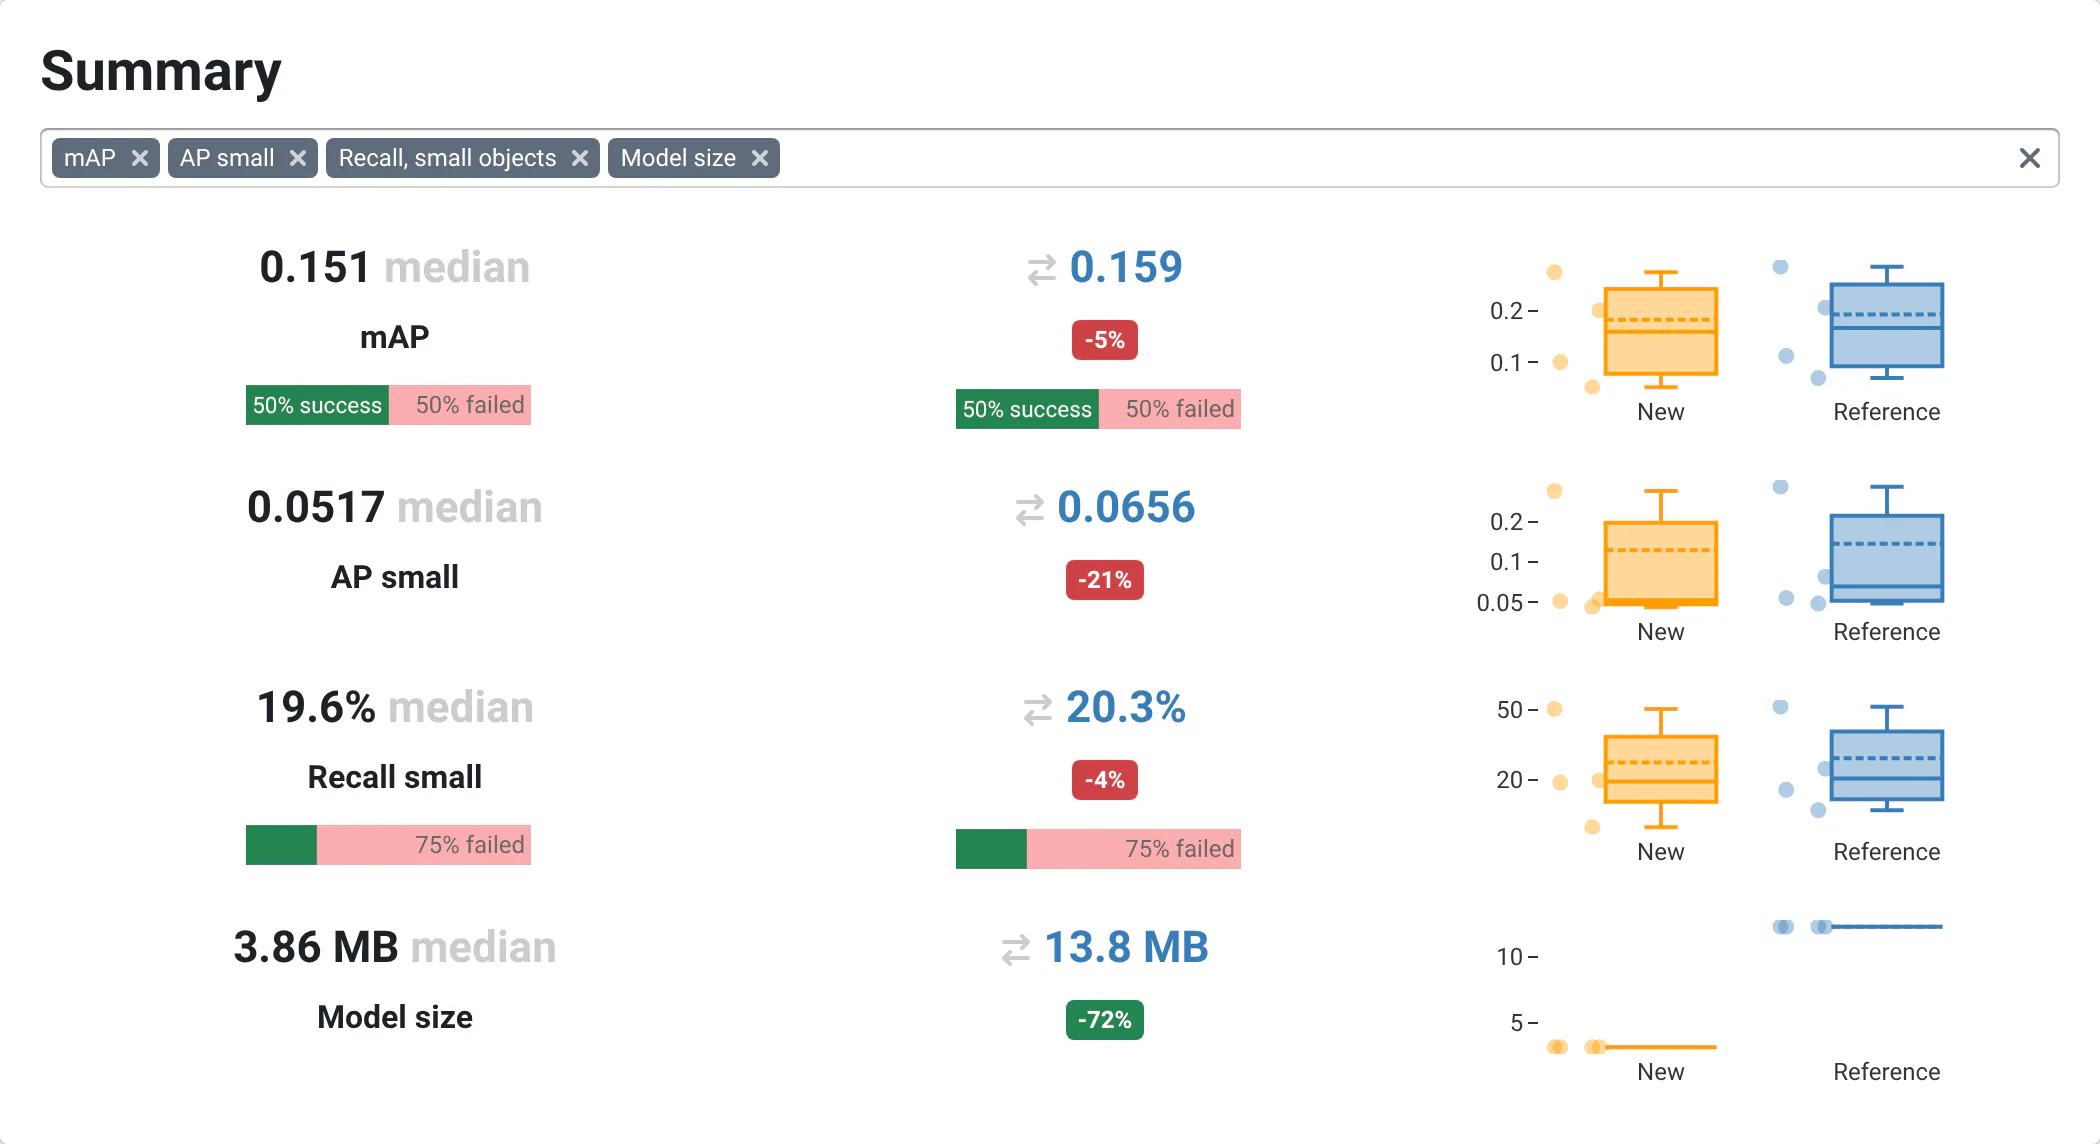
For each summary metric (pick others with the metrics selector):
- the new median, and the reference median with the change in percent, green when it improves, red when it degrades (changes under 1% stay neutral);
- when the metric has a target, a bar with the share of runs meeting it;
- box plots of the new and reference distributions, with the target zone in green or red.
If the batch mixes several values of tuning parameters, a warning reminds you that the summary aggregates them all. Filter the runs (e.g. threshold:0.5) to compare like with like.
The reference values only use reference runs on the same inputs as the new runs.
Metrics Table
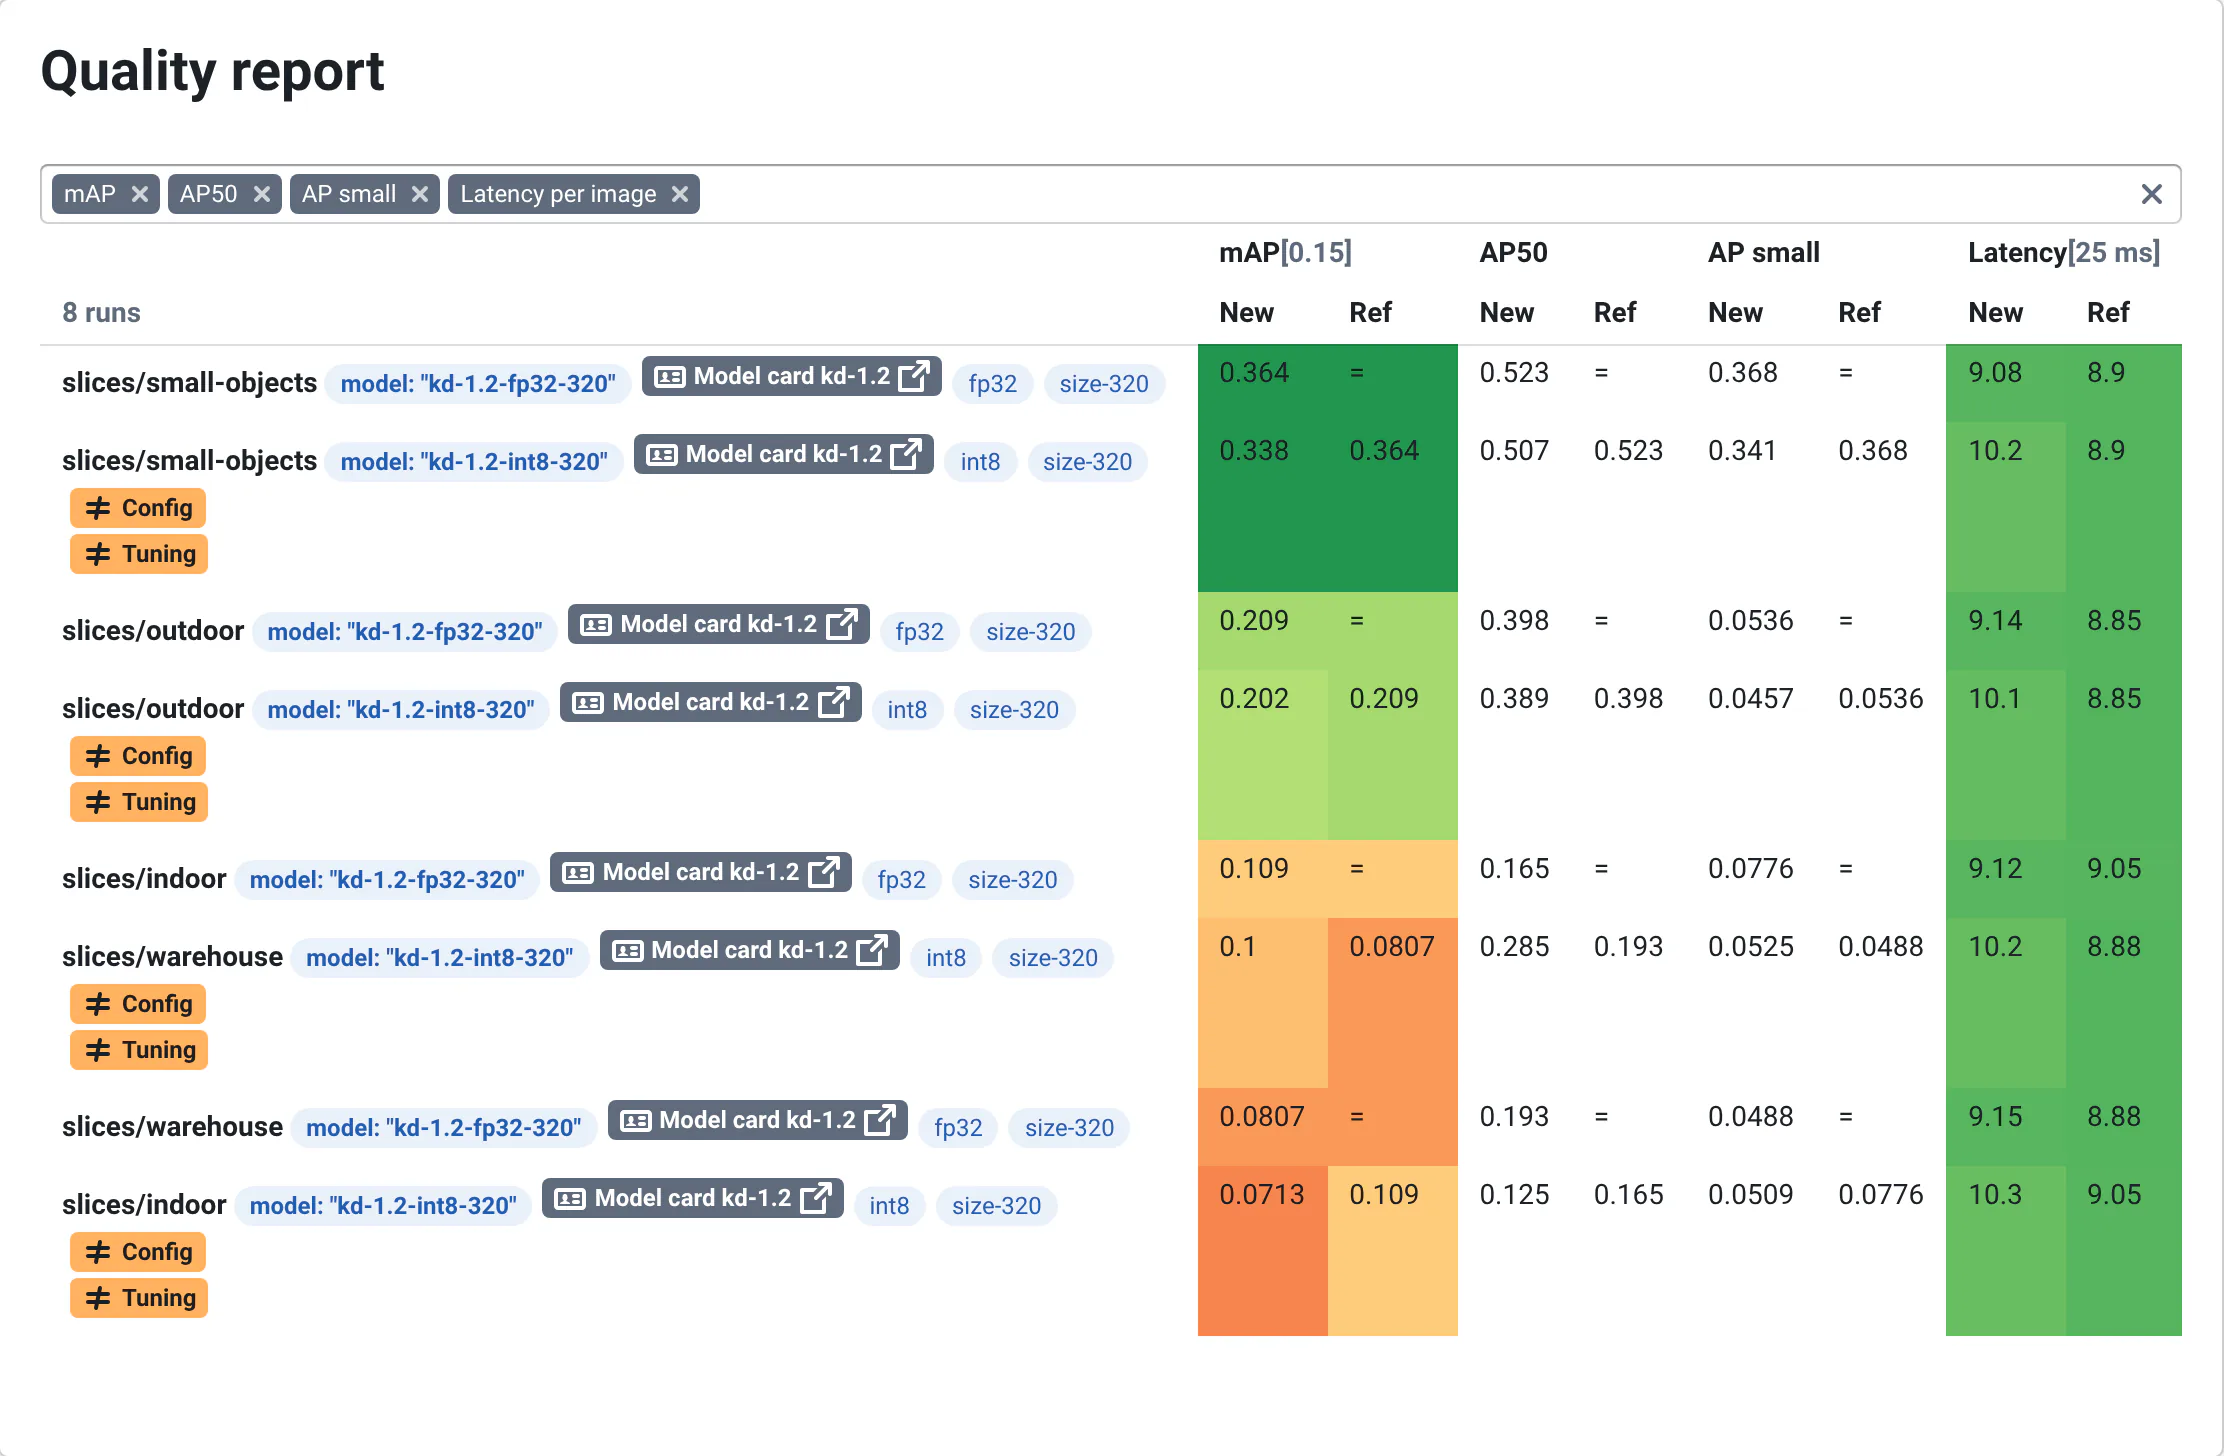
One row per run, with its input, tuning parameters, platform and configuration tags. For each metric, the New and Ref values side by side. The header shows the metric's target and unit, e.g. [0.01 cm].
When a metric has a target, cells are colored from red to green by how far they are from it (or just red/green for pass/fail metrics). A reference cell shows = when it's identical to the new value. Rows with a Failed tag crashed.
Metrics Diff
One row per run, with new − ref for each metric, and the change in percent. Cells are green when the new run is better, red when it's worse, taking into account whether smaller is better for that metric. Hover a cell to see both values. Only metrics that the reference also has are shown.
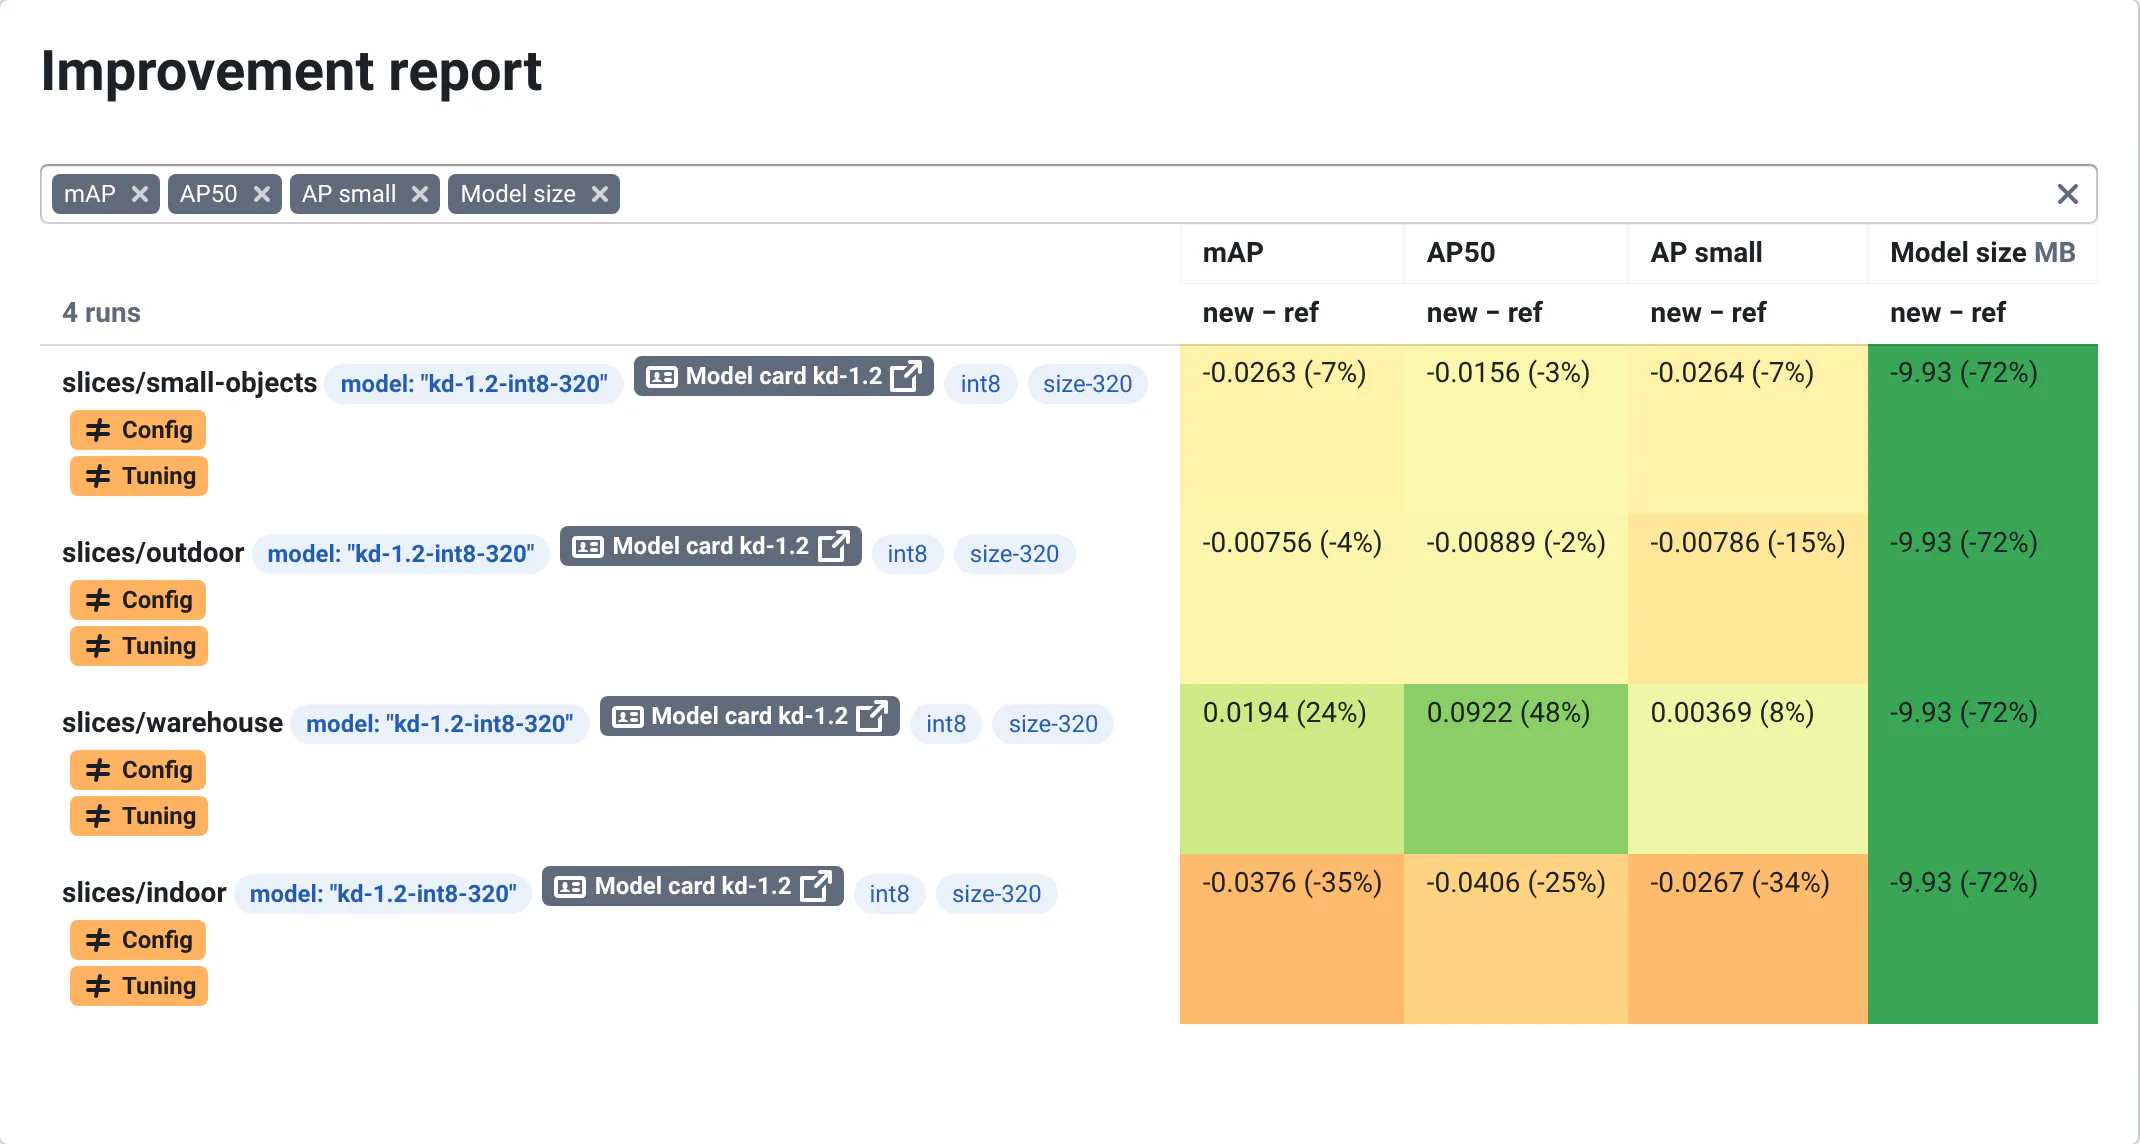
Use the Sorting section of the controls panel to sort runs by a metric, and see the worst regressions first.
Yellow Input, Config, Platform or Tuning tags (with a ≠ icon) mean the run was compared with a reference run that is not exactly the same. Hover them for details. See How runs are matched.
Visualizations
One card per run, with its main metrics (and their change vs the reference) and the visualizations configured for the project: images, plots, videos, text, HTML, flame graphs, point clouds... The reference is shown next to the new result.
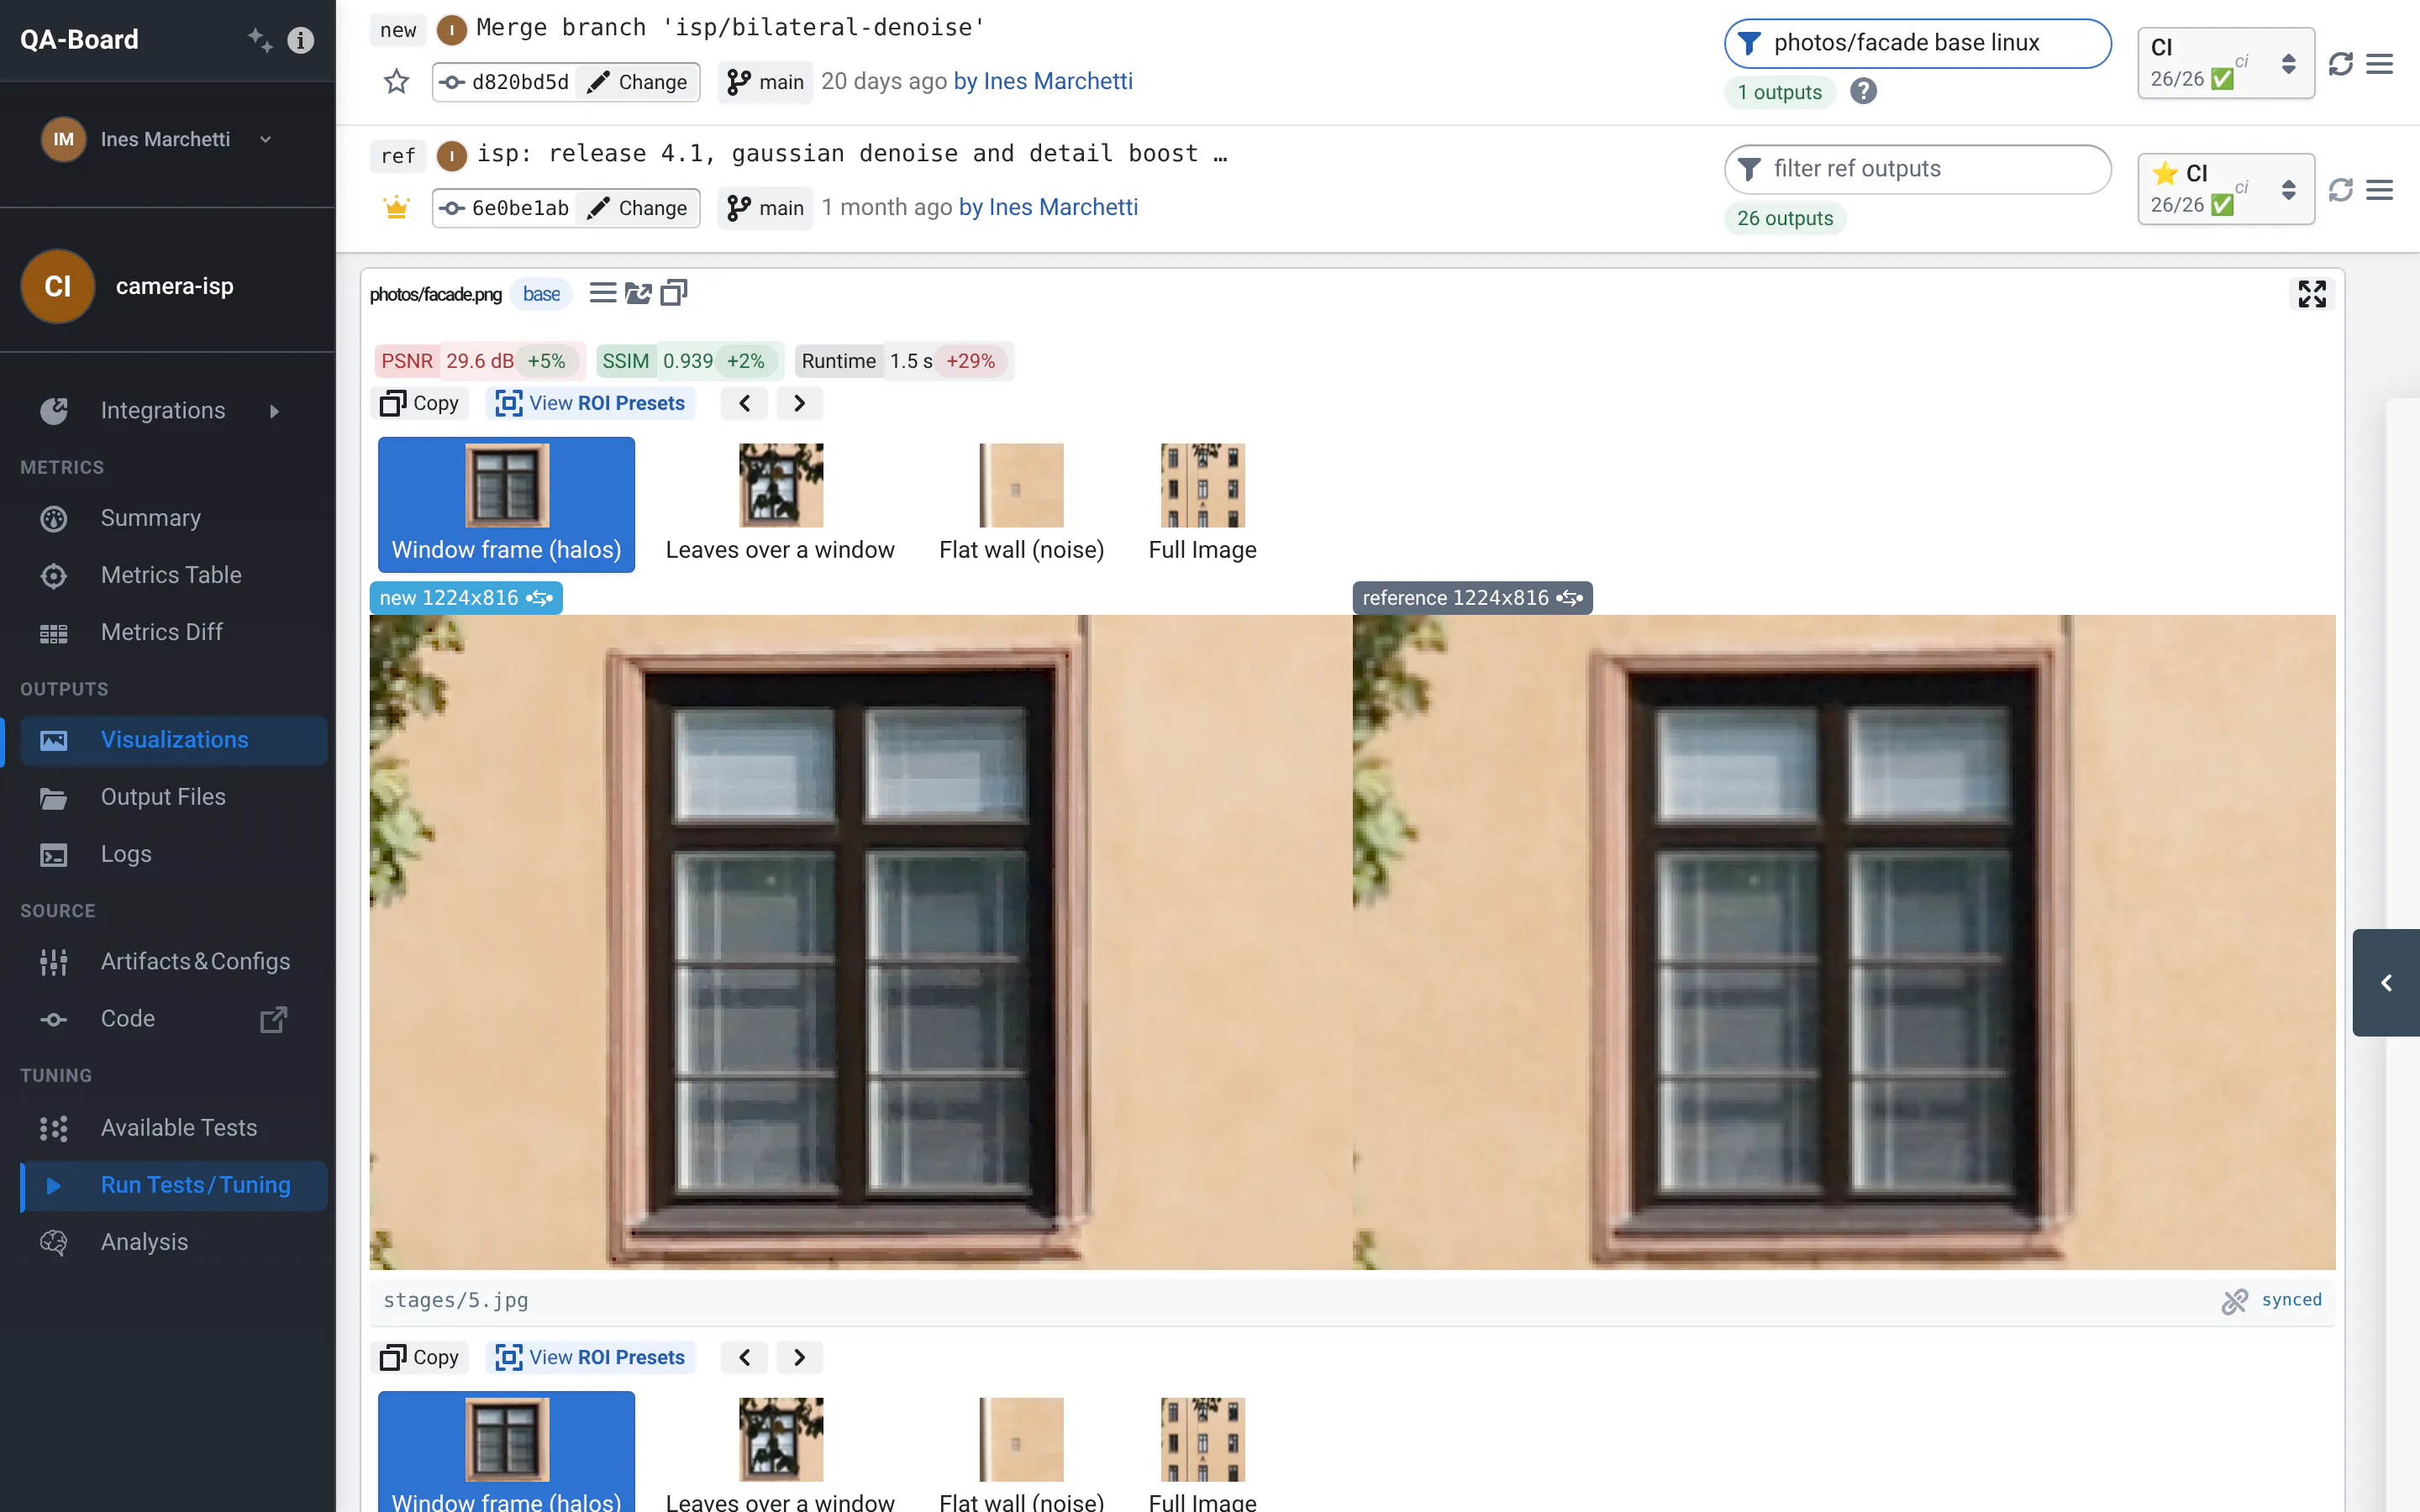
On each card:
- The run name: hover for its batch, input path and database (click to copy), metadata, compute time, date and storage. Click it to see that input's history.
- Tags for the platform and configurations: hover a configuration to copy it, as JSON or in a format you can paste in a tuning experiment.
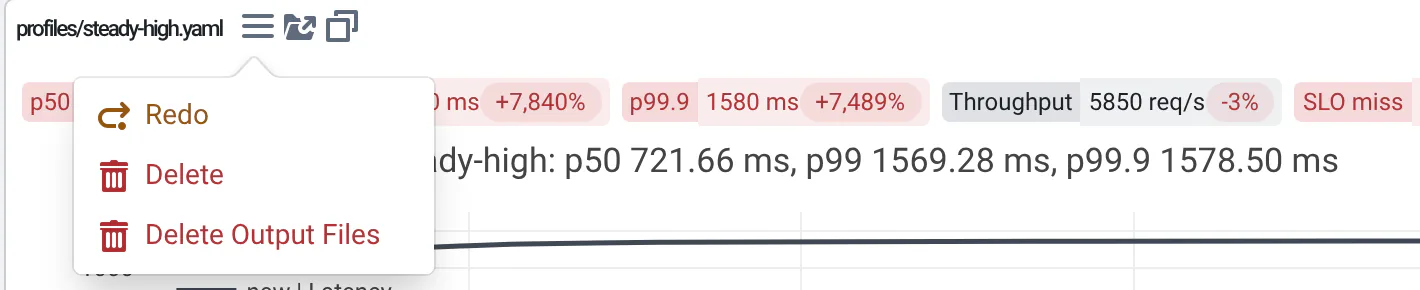
- ☰ menu: Redo the run, Mark as Failed if it's stuck, Delete it, or Delete Output Files only.
- Folder icon: open the output directory (or the reference's) in the browser. Copy icon: copy the new or reference output directory, as a Windows or Linux path.
- Fullscreen button at the top right of the card.
Cards load their files when you scroll to them. The image viewer has many tools: synced zoom, pixel values, perceptual diff, regions of interest, filters and histograms. See Comparing results and the list of viewers.
Above the cards, Export gathers matching files from all runs in one shared directory: see Sharing.
Output Files
All the files each run created, as a tree, diffed against the reference run. It shows the total storage used.
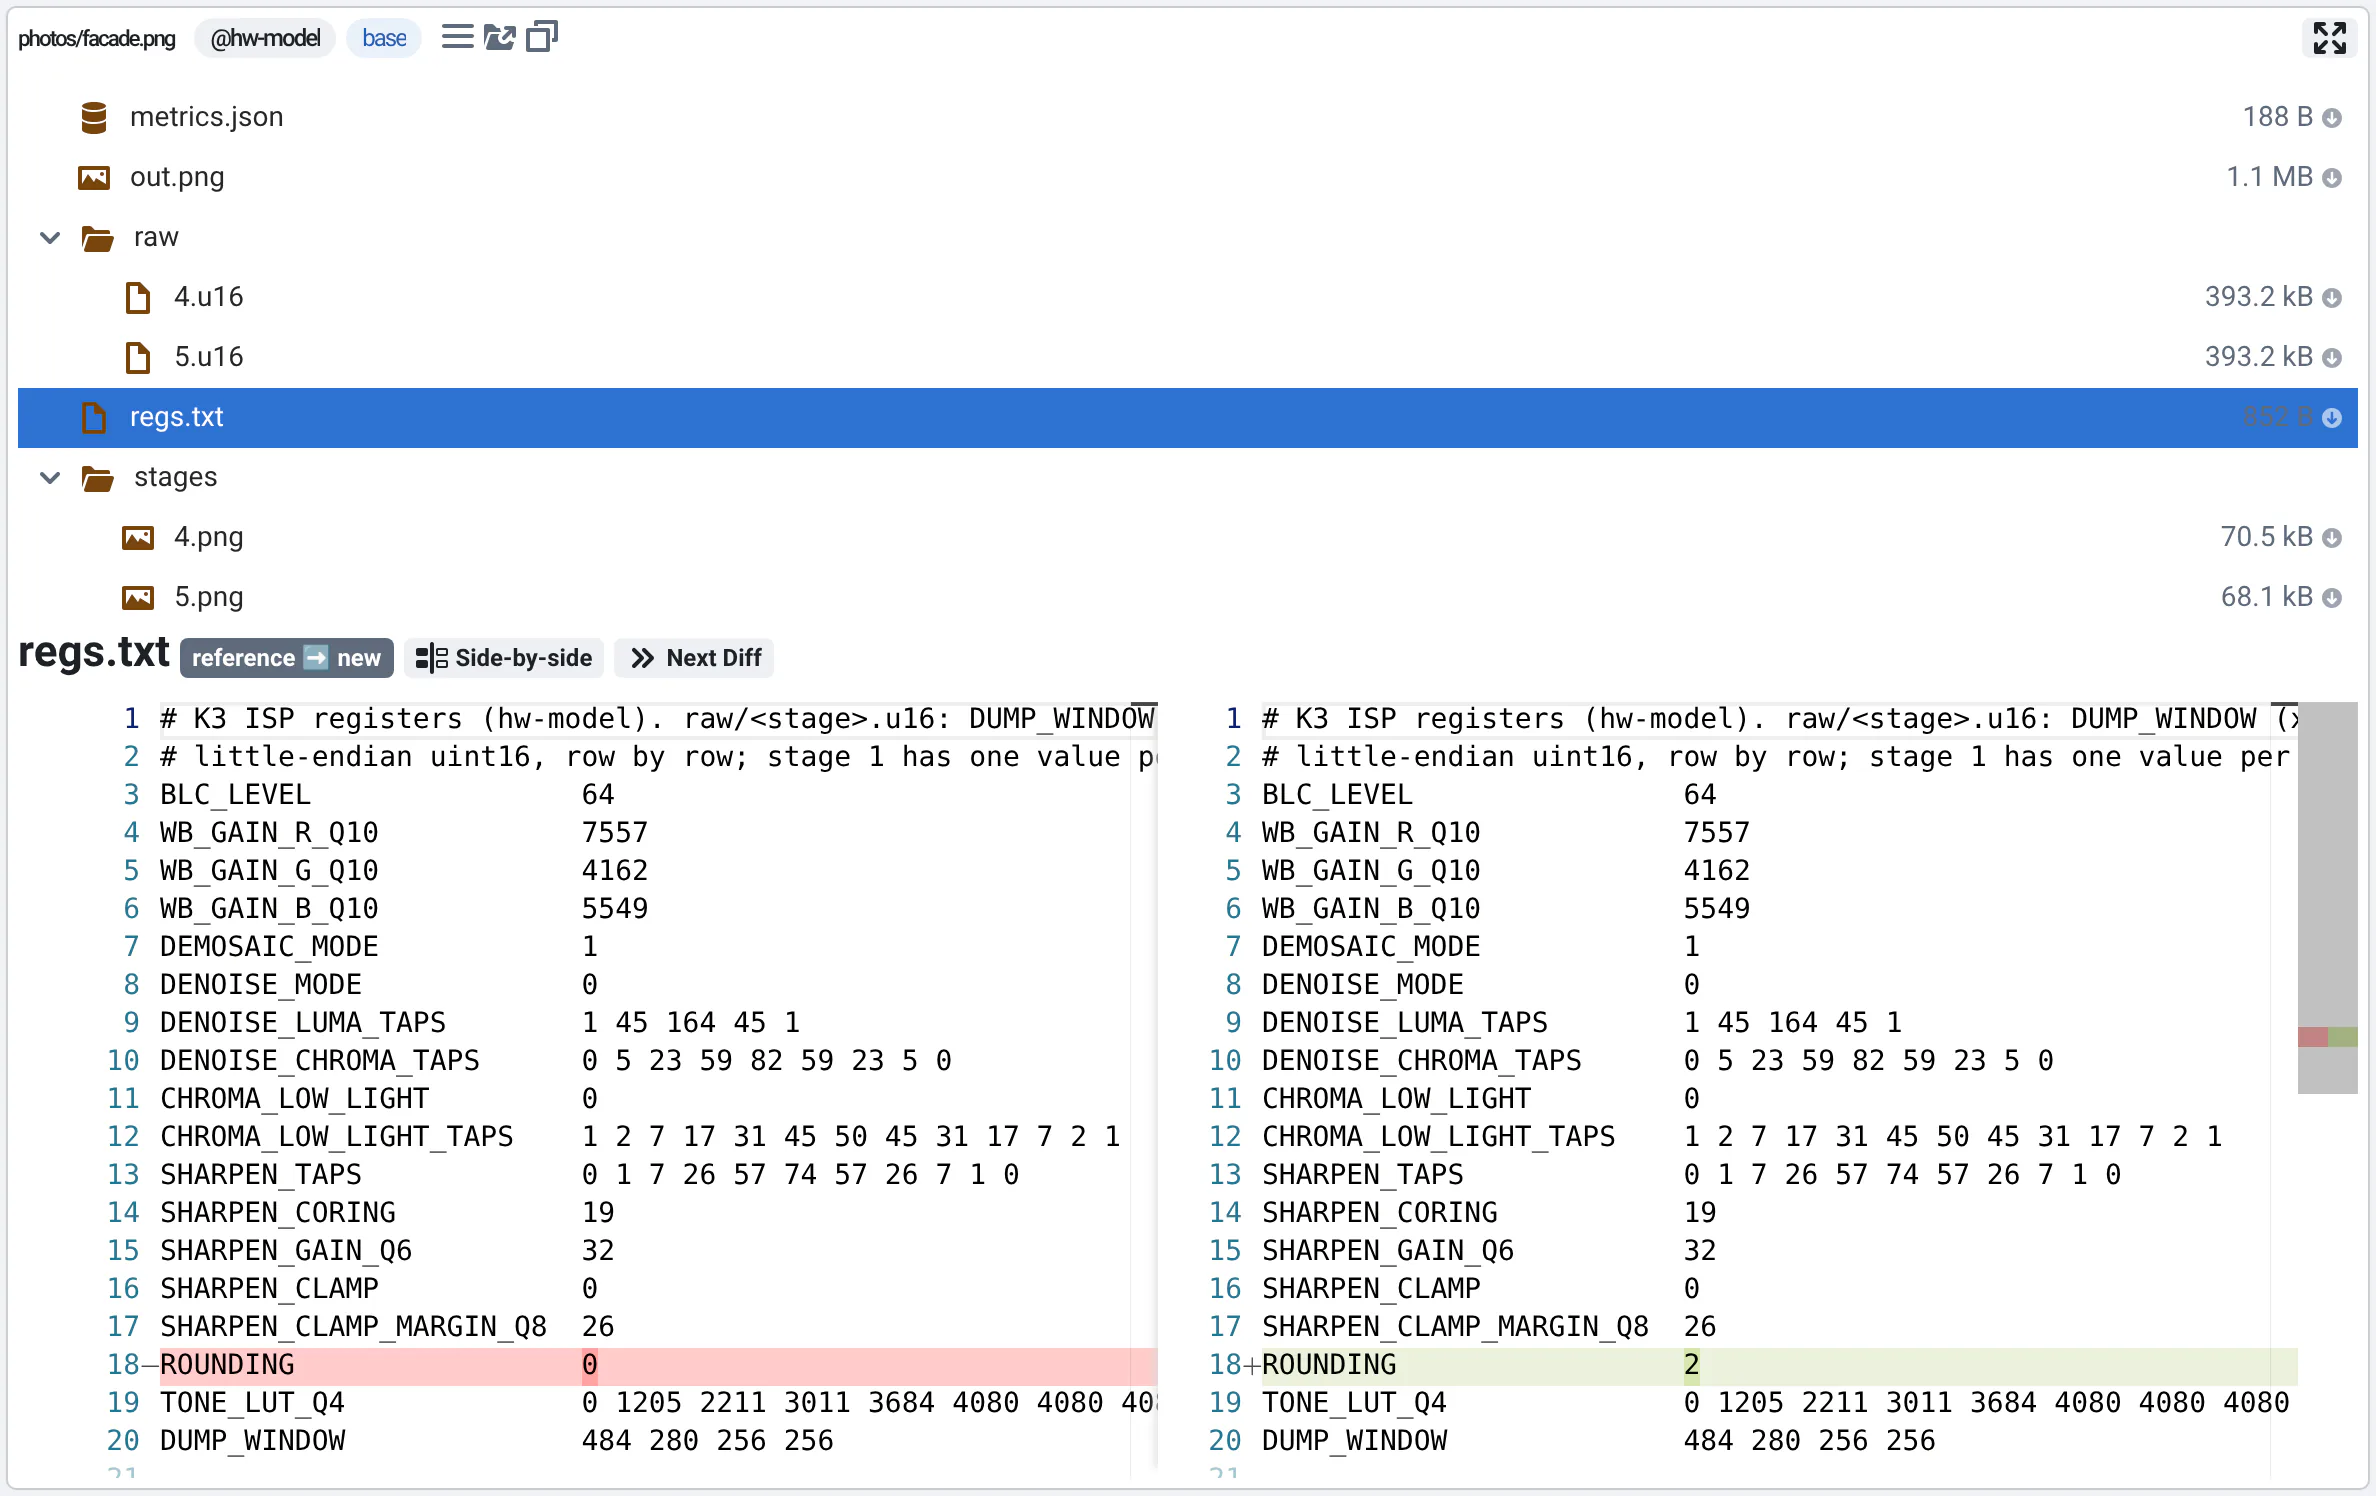
- By default only files that are different, added or removed are shown. Use Show all files, Hide runs without files, Expand all folders, Color-blind friendly and the path filter to change that.
- Click a file to see its diff with the reference. Press Ctrl or Shift to select several files.
- Hover Help for the meaning of the icons and colors: bit-accurate, different, missing in the reference, only in the reference...
- When all the files your project checks for bit-accuracy are identical to the reference's, the run is tagged Bit-accurate. Files your project doesn't check (qaboard.yaml's
bit_accuracy.patterns) are greyed and tagged not checked, like metrics.json, which has the run time.
This is the view for bit-accuracy tests.
Logs
When runs failed, the sidebar's Logs entry says how many (it also shows runs still running or pending).
One line per run: its status, its name, and its configuration in short (hover it to read it all). On the right, copy the path of the run's output directory (when your server has Windows path mappings, the confirmation offers the Windows path too), open it, or use the ⋯ menu to redo, mark as failed or delete it. Filter the runs with All, Failed or Running, and use Open failed runs to expand the logs of the failed ones at once. Big batches are paginated.
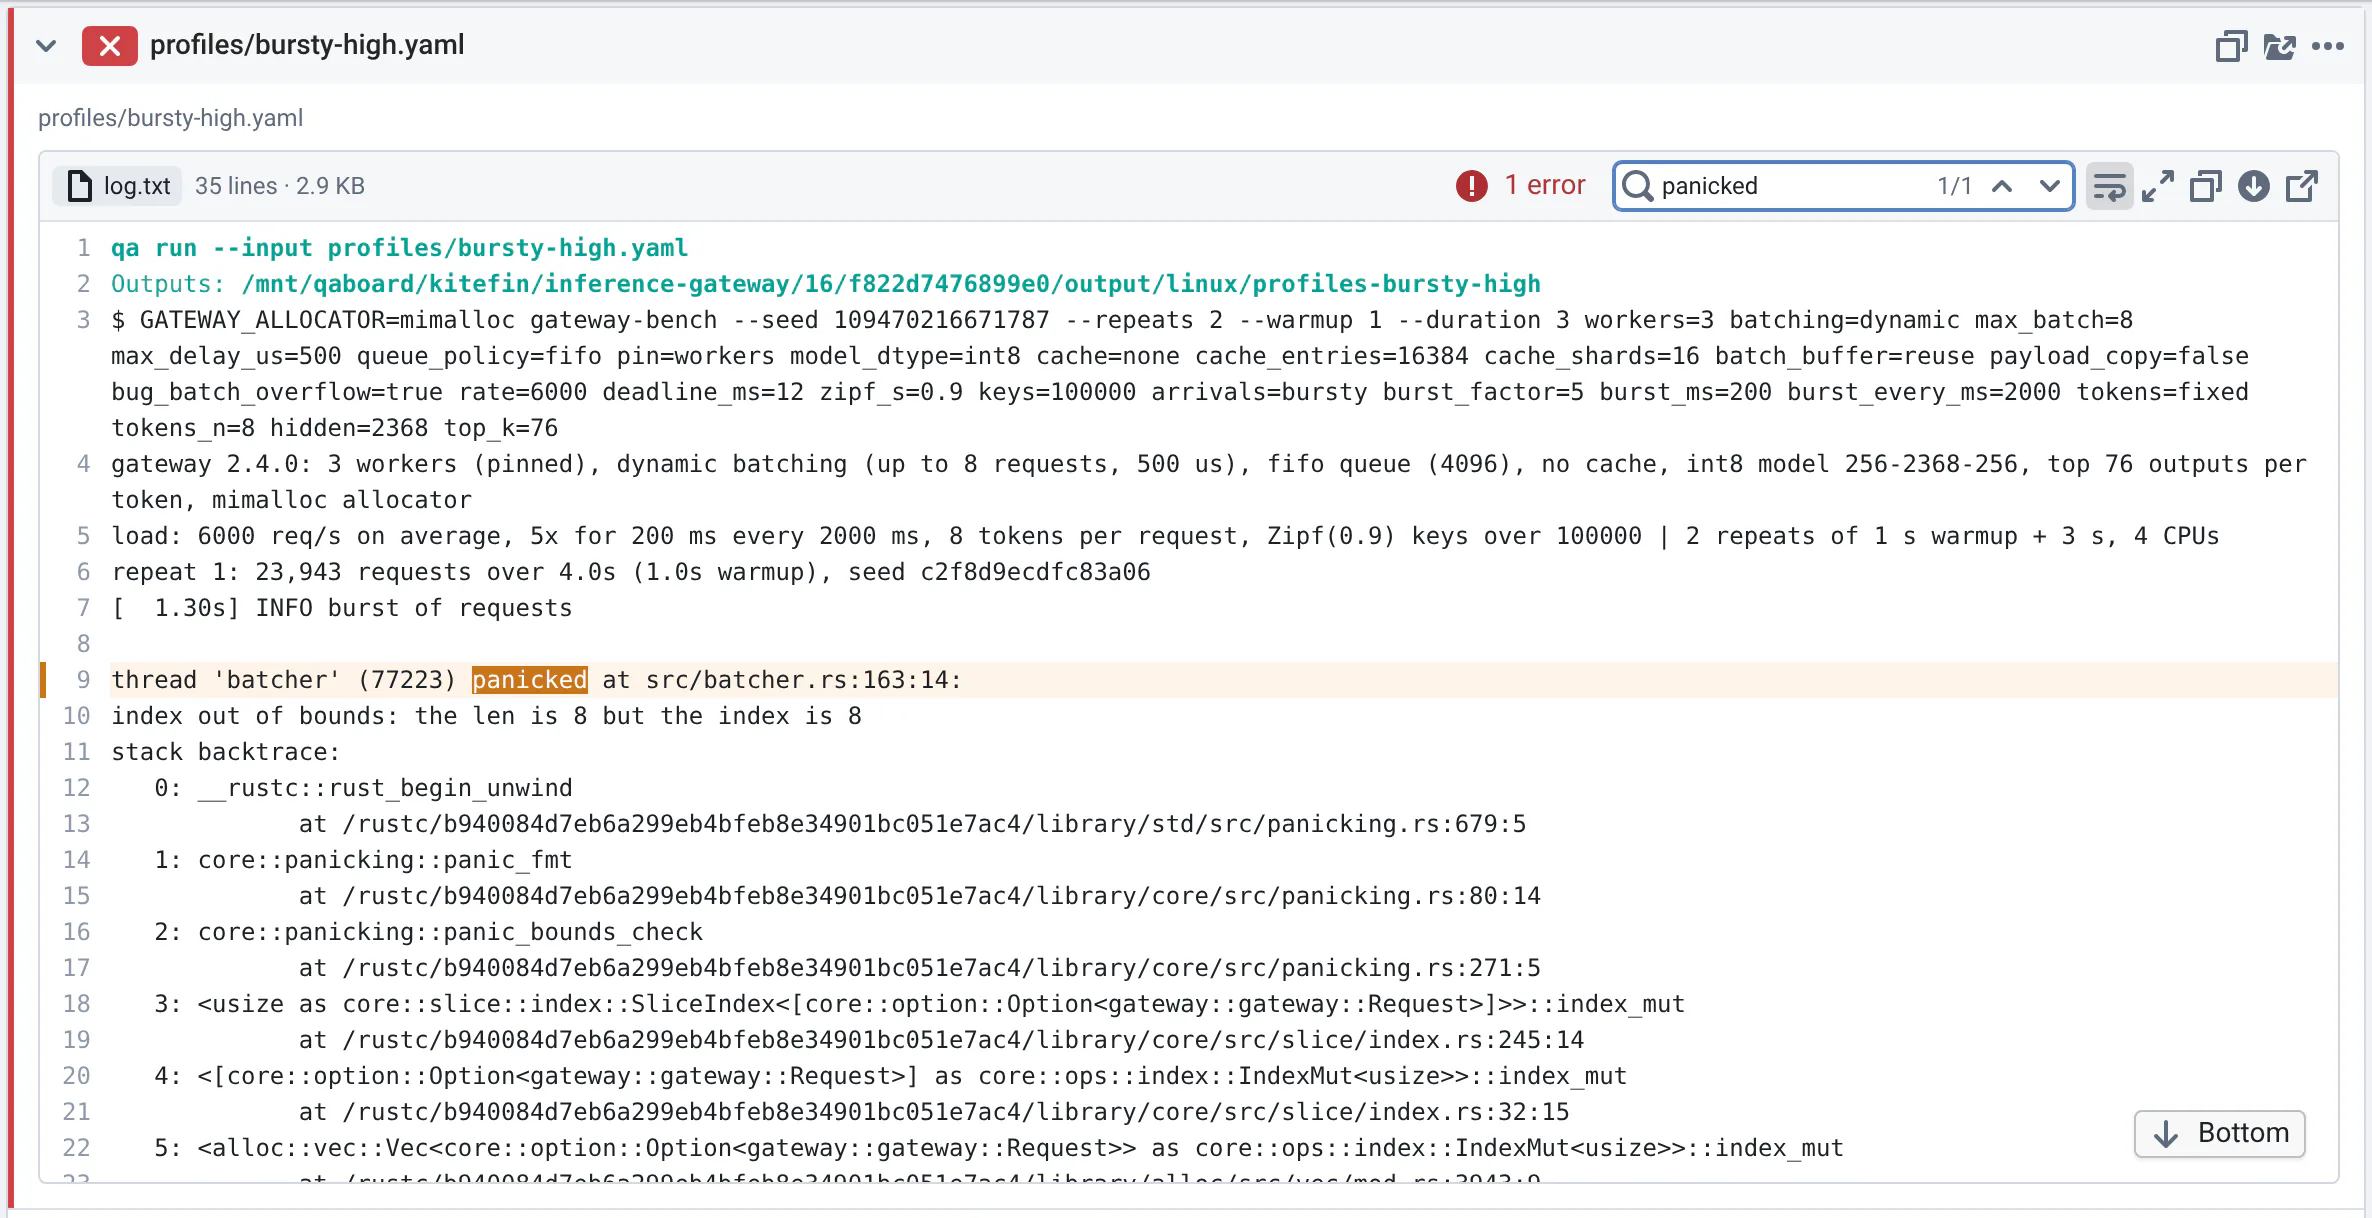
Click a run to see its full configuration (hover a tag to copy it) and read its log:
- it updates live while the run is running (only the new lines are downloaded), and follows the end like a terminal until you scroll up;
- colors, line numbers, progress bars shown like in a terminal, error and warning lines highlighted, with a button to jump to the next error;
- search (with previous/next match), wrap lines, copy, download, or open the raw file;
- switch between the run's
log.txtand, when they exist,log.lsf.txt(what LSF captured, with its job report) andlog.dask.txt; - very long logs show their last 50,000 lines, to keep the page fast: show more when you need them. If the hidden lines have errors, or matches for your search, it says how many.
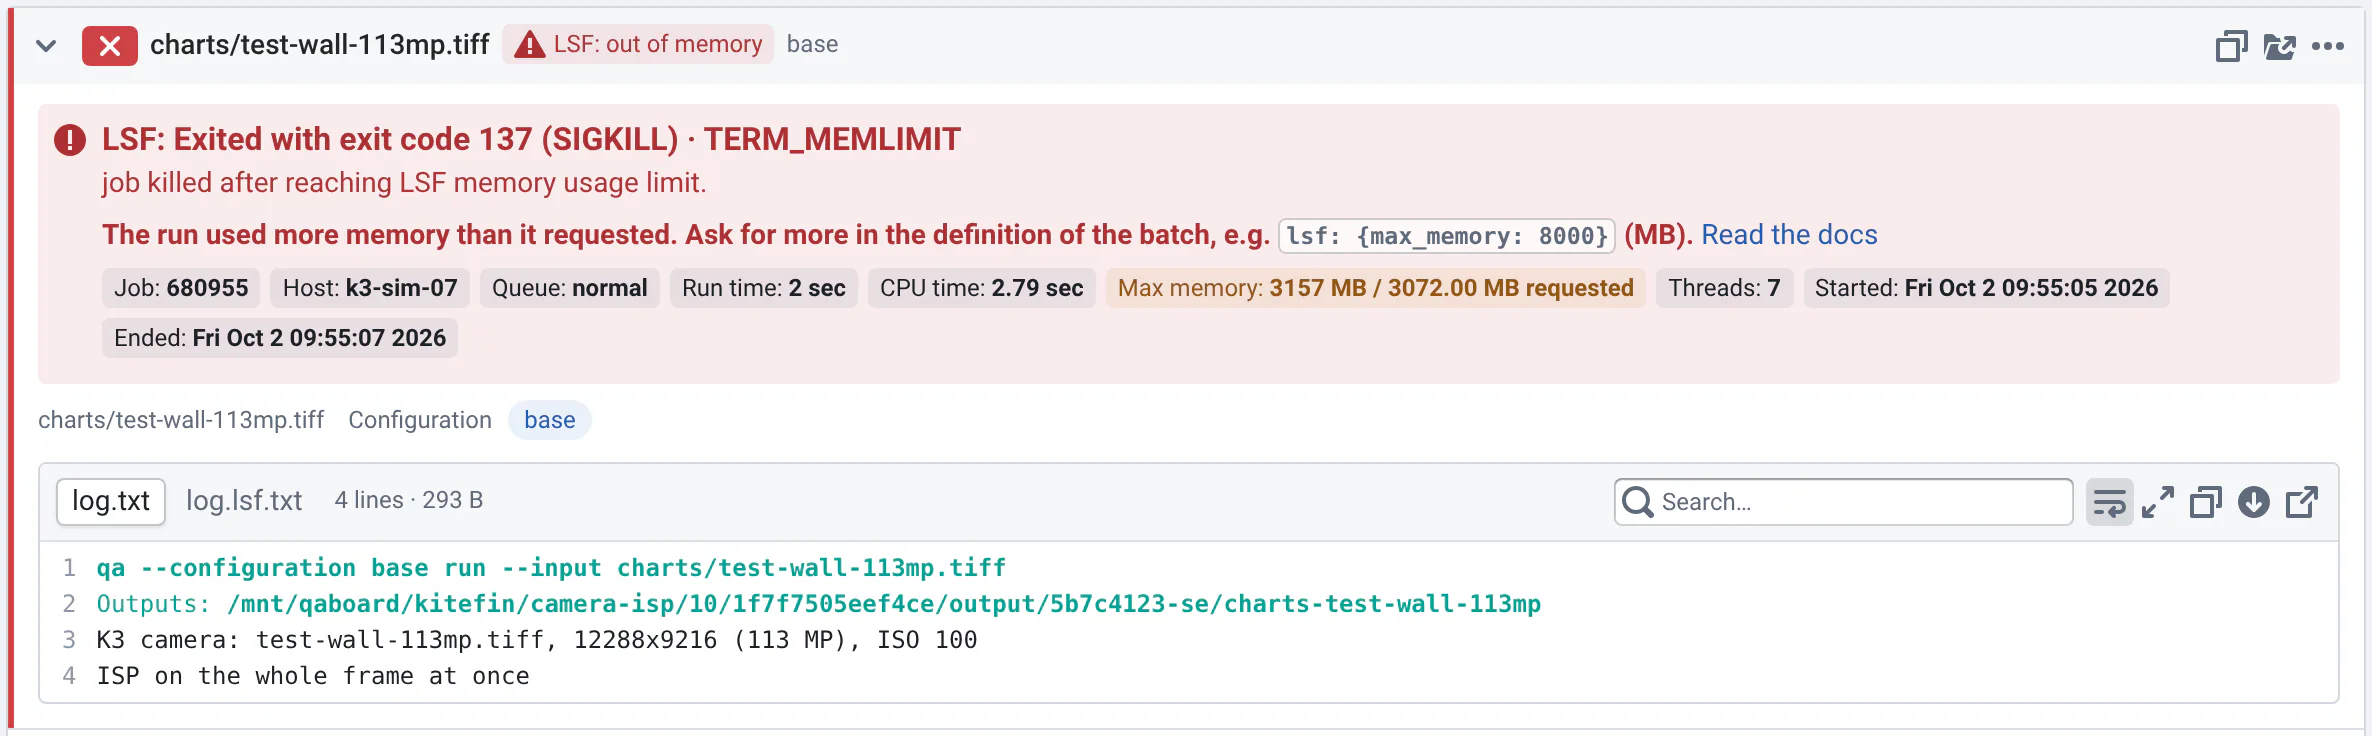
For runs on LSF, a summary shows why the job ended (e.g. out of memory, run time limit), the host, the run time and the memory used vs requested, with hints on which lsf: options of your batch to change. Failed runs are tagged with the reason.
Batches started from QA-Board (tuning, Run Tests) show a callout on every view while qa batch is waiting for LSF or running, and when it failed or didn't start any run, with the error and a link to its logs. In the Logs view, Started from QA-Board lists them with their status, command and logs, and buttons to copy or open their folder (it also has the script QA-Board ran).
At the bottom, the Batch section has buttons to copy or open the batch directory, and lists the qa batch commands that started the batch, most recent first: when, by whom, and where their logs are:
- Logs in the CI job: a link to the CI job;
- Show its logs: it was started from a terminal with
qa --share batch(orqa optimize), which saved what it printed in the batch directory; it was started from QA-Board; or it is an older batch that wrote its logs in the batch directory'slog.txt(shown as Batch logs, only when it exists); - Logs not saved: e.g. it was started from a terminal by an older version of
qaboard, which only printed its logs there.
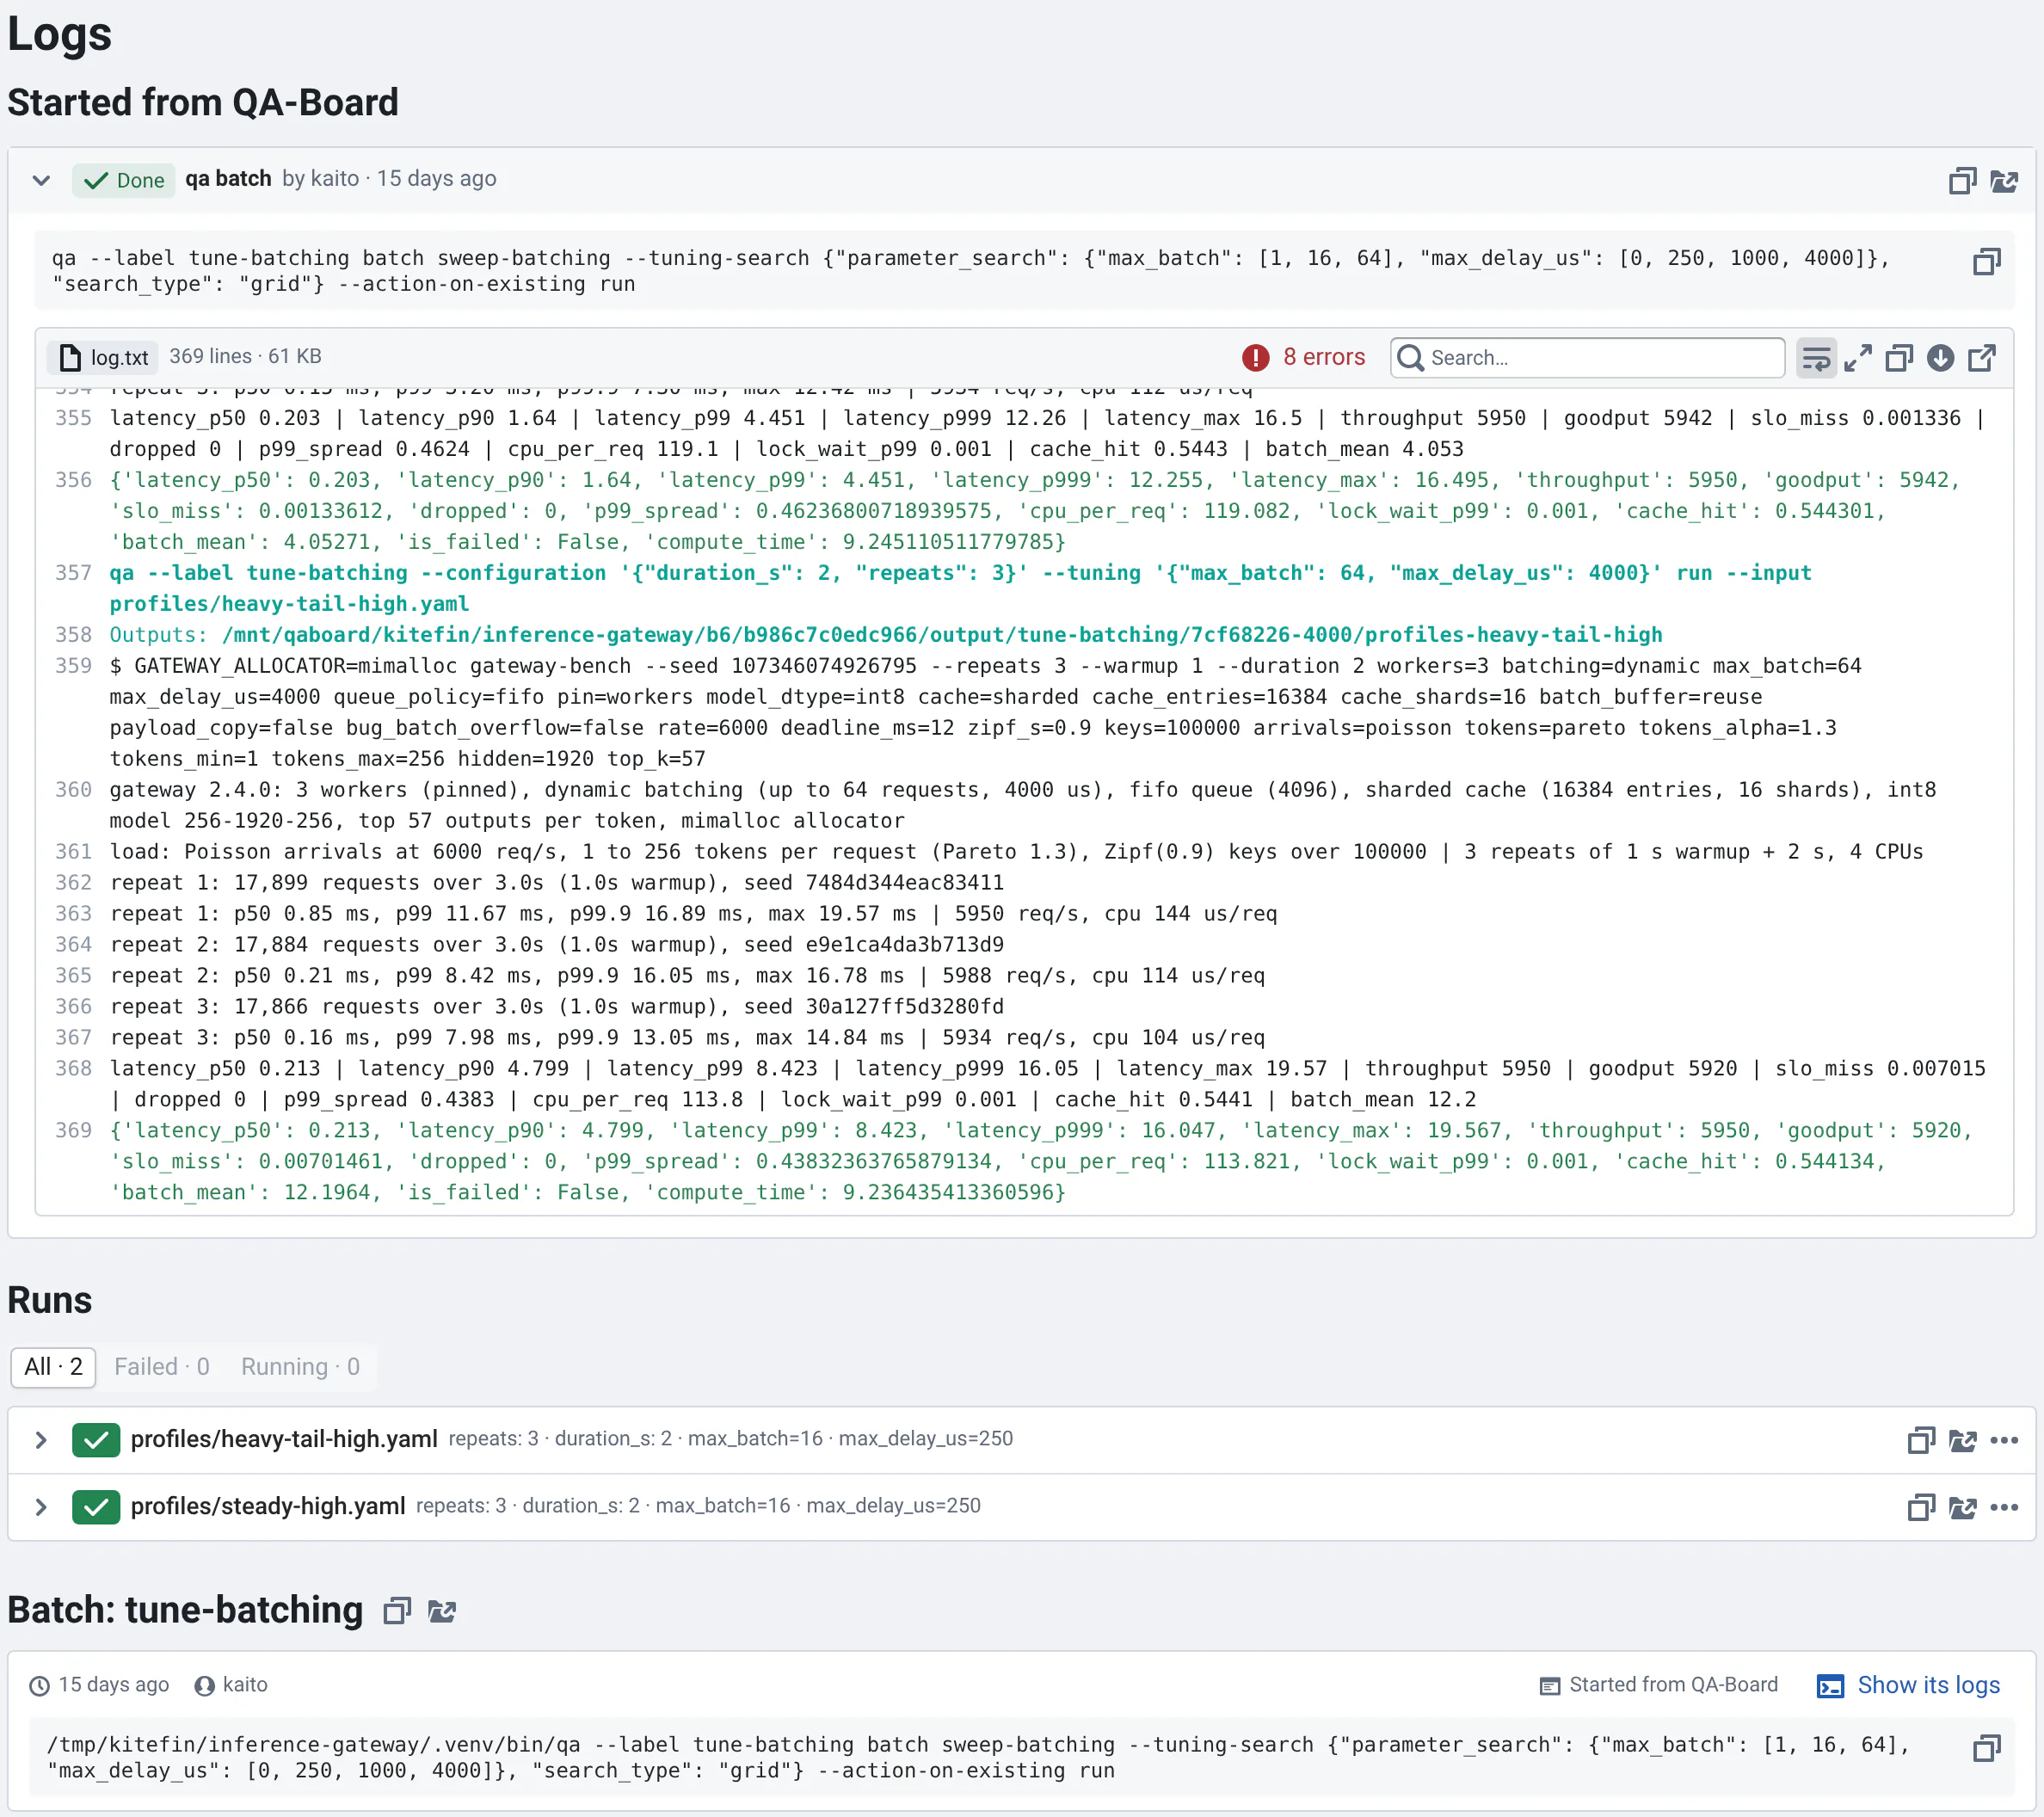
Whatever started the batch, each run's own logs are saved, in the list above. With the Dask runner, a link opens the logs of the Dask workers.
The Logs sidebar item turns red when the batch has crashed runs, and the Outputs section shows the number of crashes.
Artifacts & Configs
Compares the commit's artifacts with the reference commit: the configuration files, the build, and any other artifacts the project saves. Pick which artifacts to explore with the buttons at the top.
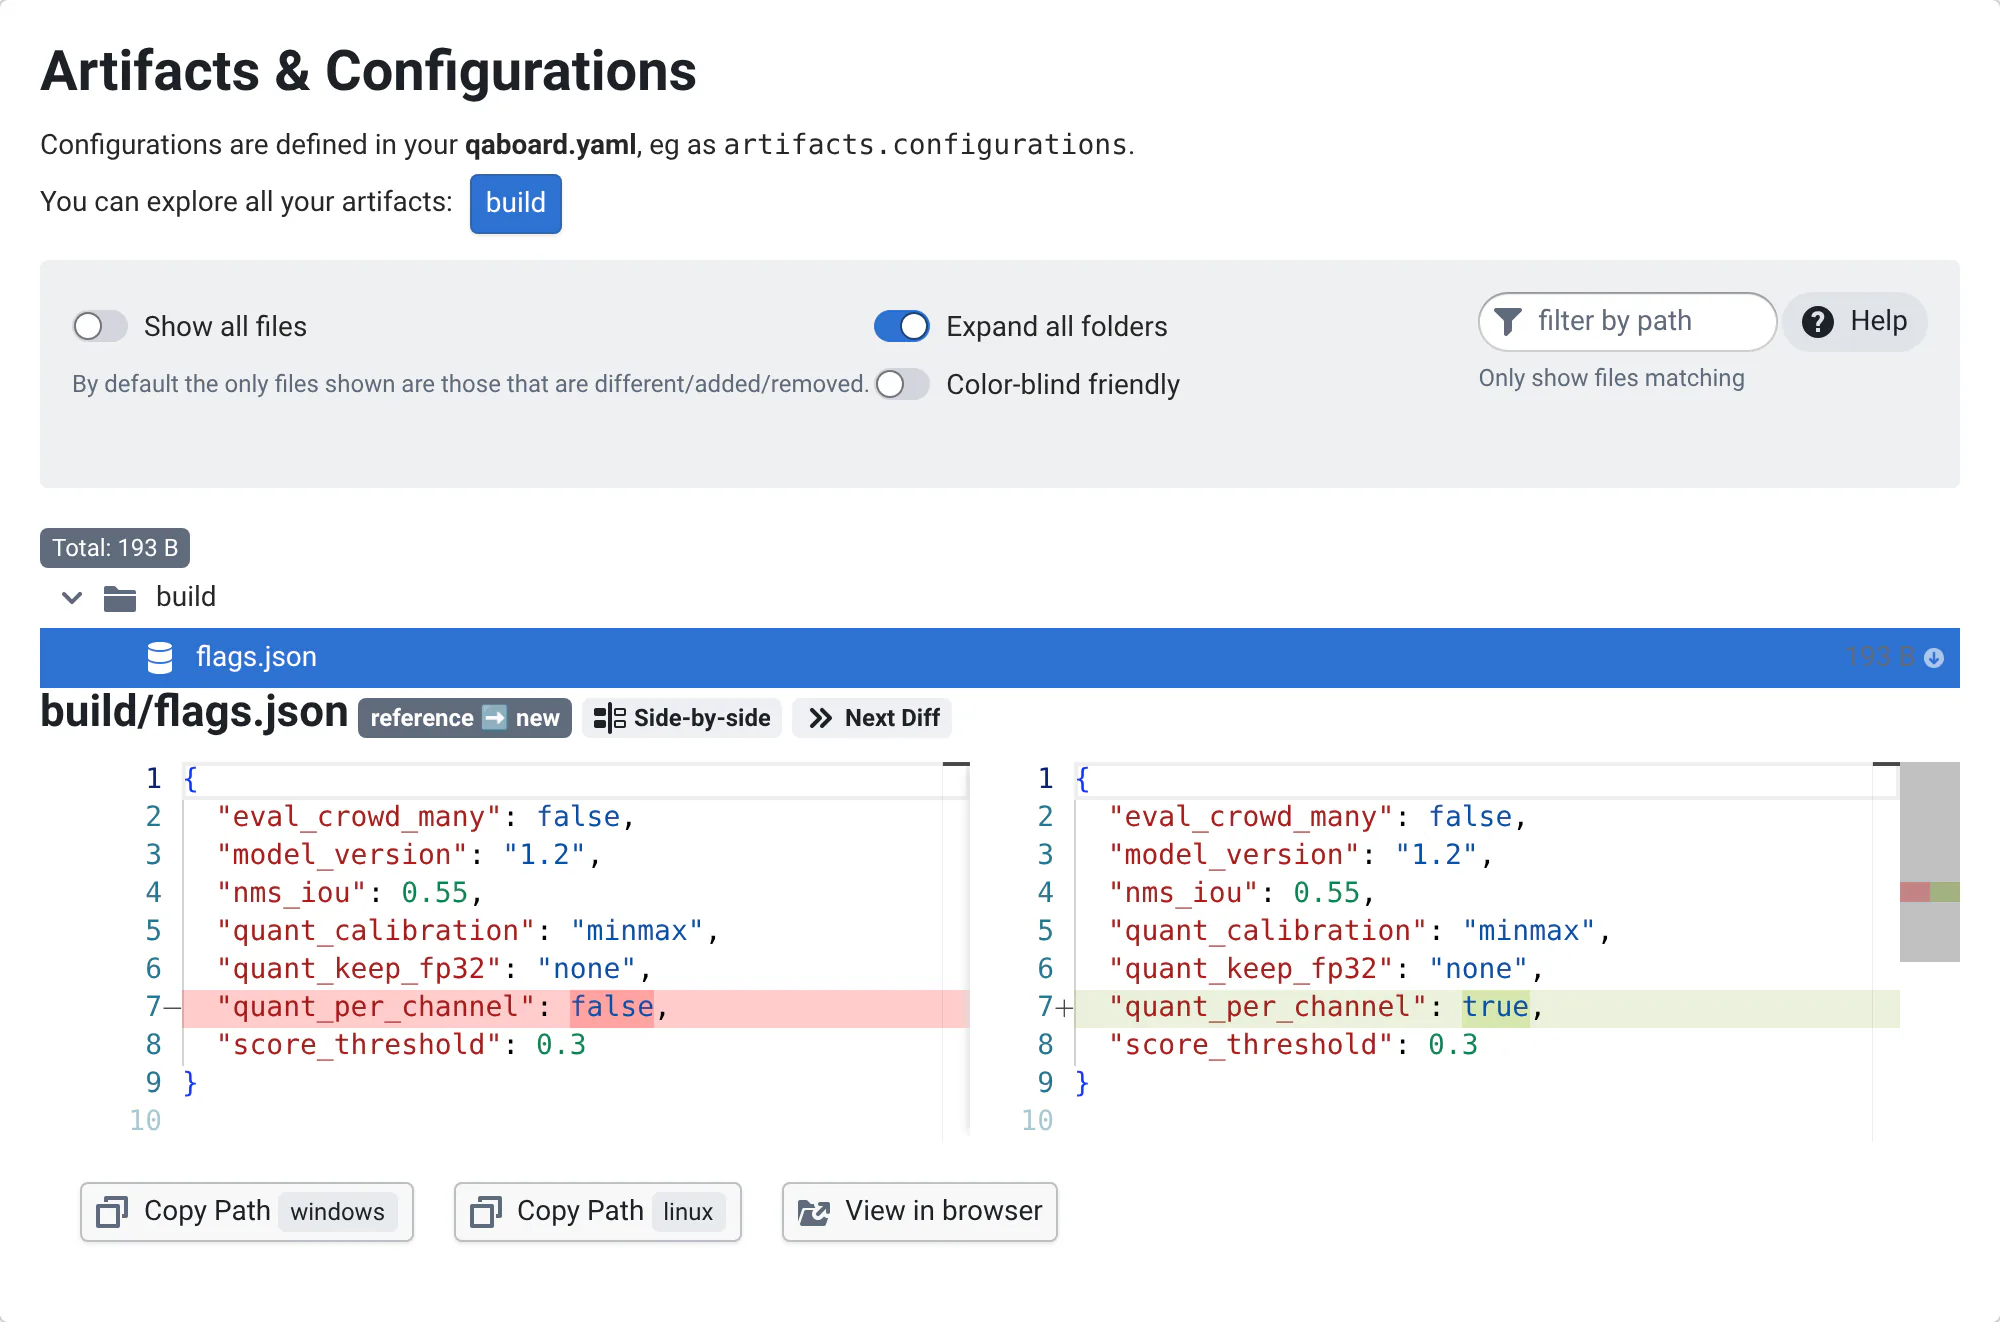
It works like Output Files: only differences are shown by default, click a file to diff it. Buttons at the bottom copy the artifacts directory path (Windows or Linux) or open it in the browser.
If the artifacts are missing, the page tells you to run qa save-artifacts from the commit's workspace.
Code
Opens the commit on your git server, in a new tab. In a monorepo, it opens the project's sub-folder.
Available Tests
Edit the batches of inputs you can run, in two files:
- Private: only you can see and edit it,
- Shared: every QA-Board user can see and edit it.
The commit's own batch files (inputs.batches in qaboard.yaml) are linked in the side panel. QA-Board reads them from the commit's artifacts, where qa save-artifacts saves them. When a batch is defined in several places, Private overrides Shared, which overrides the commit's files; among the commit's files, the last one wins, like for qa batch. For the syntax, see Batches of inputs. You need to be logged in.
- Save (or Ctrl+S, ⌘+S on a Mac). The status next to the button tells you if there are Unsaved changes, when it was Saved, or why it was Not saved. A dot on a file's tab means it has unsaved changes.
- YAML mistakes are underlined while you type, and listed below the editor: click one to go to its line. A batch defined twice is flagged too, since only its last definition is used.
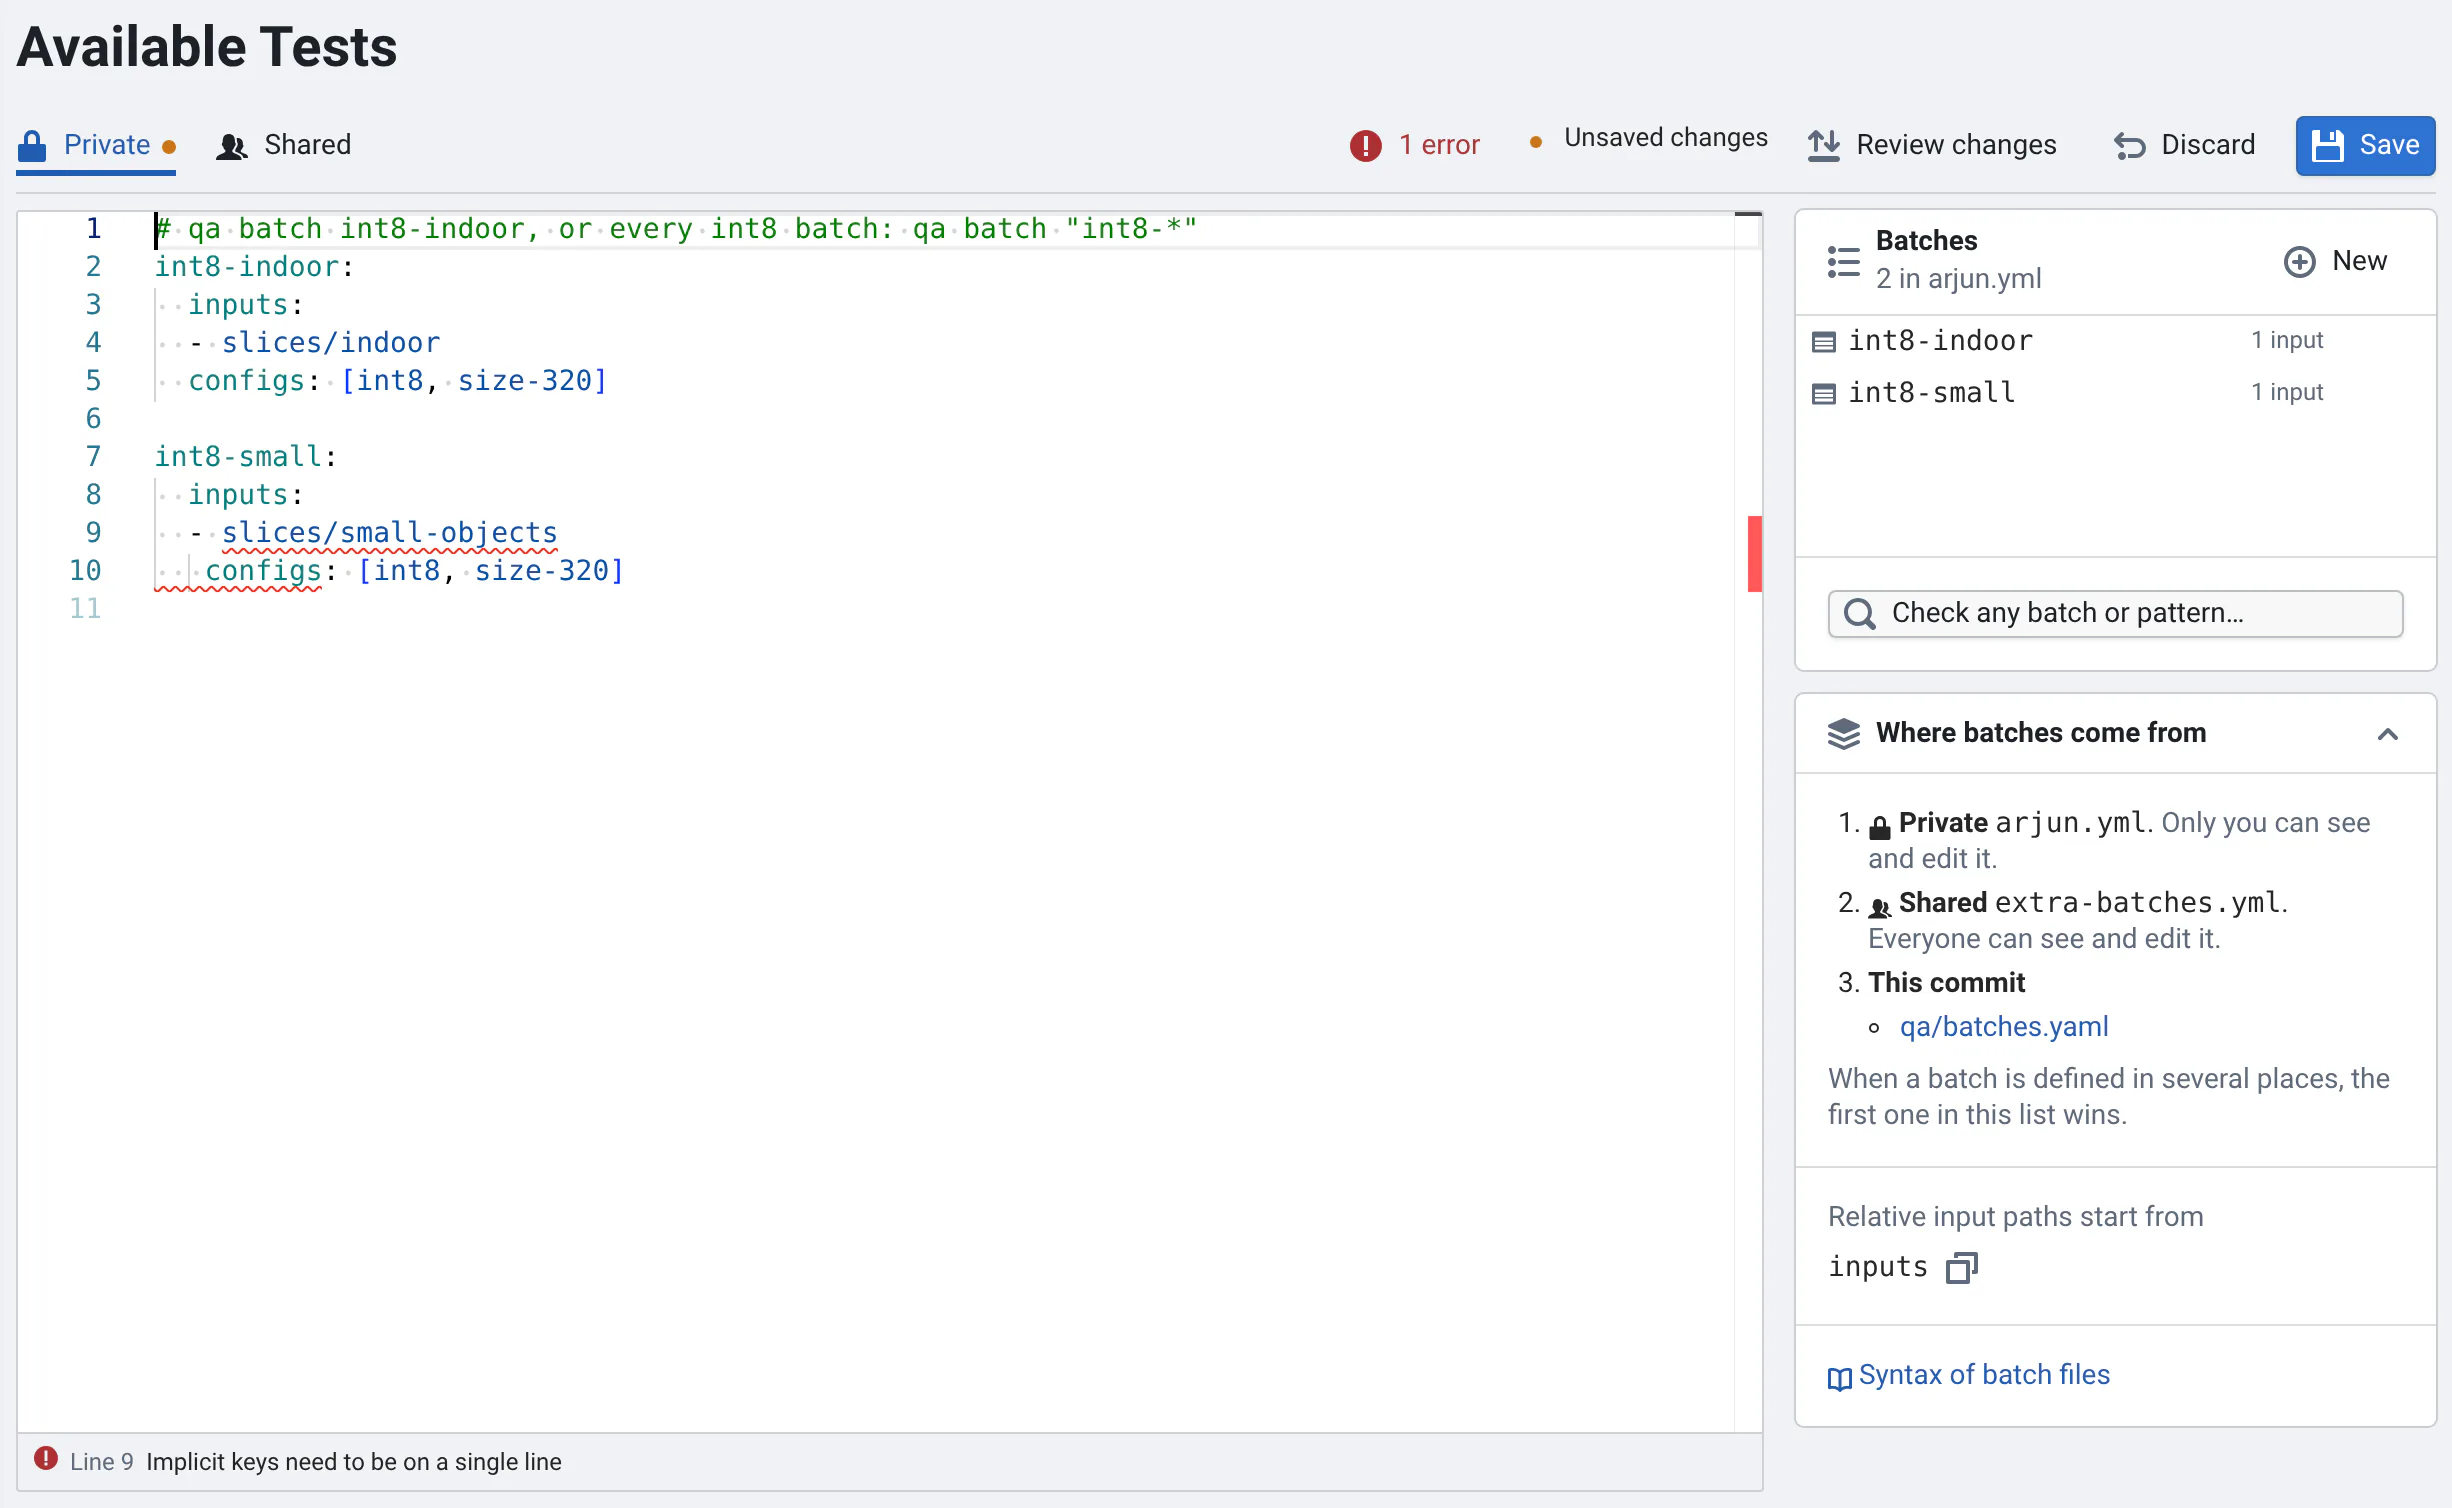
- Review changes shows what you changed since the last save, and Discard drops it (with an Undo).
- The Batches panel lists the batches and aliases in the file, with their number of inputs: click one to go to its definition. Hover it to list its tests (the inputs and configurations it resolves to on this commit, with all the batch files) or to run it from the Run Tests / Tuning view. Check any batch or pattern does the same for any batch, like the commit's, or a pattern like
nightly-*. Listing tests uses the saved files.
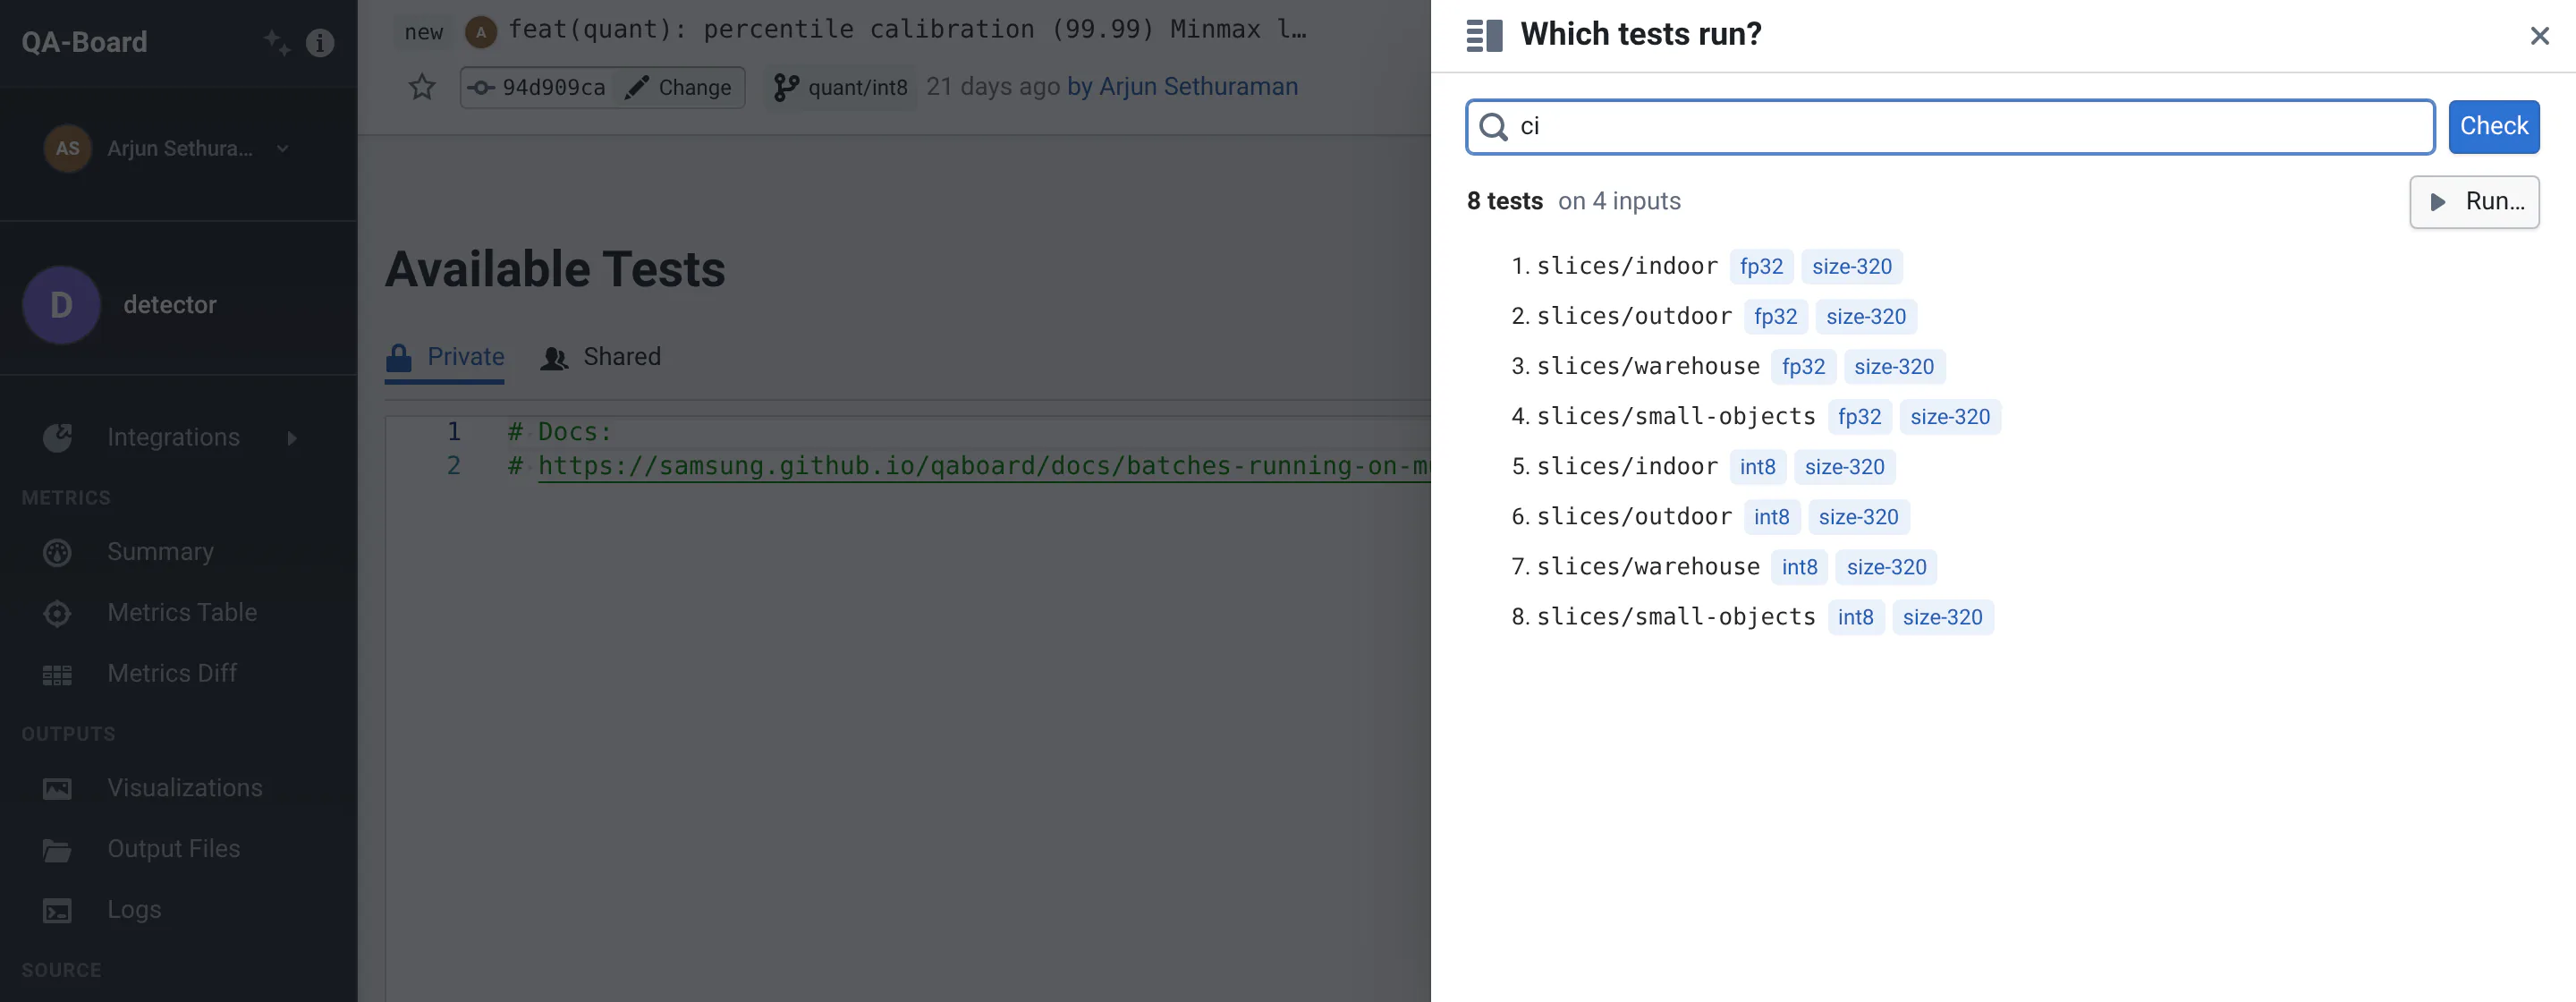
Below the tests, Which tests run? says which file defines the batch, and lists the batch files QA-Board read, in order. When a batch has no tests, or a file has a problem, a warning says why:
-
a file listed in
inputs.batchesis not in the commit's artifacts: the list shows where QA-Board looked for it. Check its name, and runqa save-artifactson the commit (the CI usually does it), -
a file is not valid YAML,
-
no file defines the batch,
-
the batch has an input
qa batchcan't use, like an empty-or a number that should be in quotes: the error gives the file and line, -
the batch's inputs were not found under the database, as the QA-Board server sees it: for instance when the database is not mounted on the server.
-
New adds an example batch to start from.
Your unsaved changes are kept in your browser: if you switch views, reload or close the tab, they come back the next time you open the view. If someone saved the same file while you were editing, saving shows both versions side by side, and lets you keep editing, use the saved file, or overwrite it with yours.
Run Tests / Tuning
Starts new runs of this commit's code on a batch of inputs, optionally with tuning parameters. See Running from the web app.
Analysis
For a tuning batch: how metrics depend on the tuning parameters. It shows the number of runs and inputs, the sensitivity to each parameter (and to pairs of parameters), a breakdown by test, and the trade-off between two metrics. For an automated tuning (optimization) batch, it also shows the best parameters found and the convergence. Use the batch selector to pick the tuning batch first.