Your project on QA-Board
By the end of this tutorial, every commit you push runs on your test set, and QA-Board shows its outputs and metrics next to your reference branch's. Pick your stack: the steps follow your choices.
The steps below follow your choices, on this page and the next ones.
qa runs your code where you start it, saves each run's output files in a storage the server reads at the same path
(by default /mnt/qaboard, usually an NFS share), and sends the metrics to the server. Every machine that saves
results with qa, CI runners included, must mount that storage. Uploading outputs over HTTP, so that any machine can
save results, is on the roadmap.
1. Start a server
- Docker Compose
- Kubernetes (Helm)
- To try it on your computer: follow the quickstart. One Compose
file starts QA-Board, with the results folder in
/tmp/qaboard. - For your team: follow Starting a QA-Board server on a Linux host:
- Create the results folder,
/mnt/qaboard, and share it with the machines that will runqa(NFS, Samba...). - Add a site overlay that mounts it in the backend and in nginx (start from
deployments/example.yml). - Start QA-Board with
deployments/deploy.py. It answers on port 5151.
- Create the results folder,
- To try it on your computer: follow the quickstart. kind shares
/tmp/qaboardbetween your computer and the cluster. - For your team: install the chart on your cluster, with results storage that pods and the machines running
qaboth mount at the same path, e.g. an NFS share or aReadWriteManyvolume (the chart'sresultssetting). See Running QA-Board on Kubernetes.
Already have a server? Note its address, <your-qaboard> below, and go to the next step.
The API that saves results doesn't require a login yet: keep your server on a network you trust. Token-authenticated ingest is on the roadmap.
2. Install the command line
- Python
- Any executable
qa imports your code, so install it where your code's dependencies are, e.g. your project's virtual environment:
pip install qaboard
qa runs your executable, so it only needs Python. Install it as a tool:
uv tool install qaboard
pip install qaboard works too.
Then point it to your server, e.g. in your shell's profile, and check that qa is installed:
export QABOARD_URL=http://<your-qaboard>
qa --help
<your-qaboard> is your server's address, e.g. localhost:5151. More options, like API tokens, are in
Installation.
3. Wrap your code
At the root of your repository, qa init creates qaboard.yaml and a qa/ folder: qa/main.py (the wrapper),
qa/batches.yaml (your test sets) and qa/metrics.yaml (your metrics).
qa init
qa calls the run(context) function of qa/main.py for each run. It runs your code on context.input_path,
writes files in context.output_dir, and returns metrics.
- Python
- Any executable
Import your code and call it:
from my_project import process  # your code


def run(context):
    result = process(context.input_path, params=context.params)
    result.image.save(context.output_dir / "out.png")
    return {"psnr": result.psnr, "is_failed": False}
context.params merges your configurations and tuning parameters. The
camera ISP example is a complete project to
copy from: its qa/main.py saves the output and each stage of the pipeline, and returns quality metrics and the
runtime.
Run your executable, then read what it wrote:
import json
import subprocess


def run(context):
    process = subprocess.run([
        "build/my-tool",
        "--input", str(context.input_path),
        "--output", str(context.output_dir),
    ])
    if process.returncode != 0:
        return {"is_failed": True}
    metrics = json.loads((context.output_dir / "metrics.json").read_text())
    return {**metrics, "is_failed": False}
qa doesn't build your code: build it first, in CI too.
Then tell qa about your project and where your inputs are. In the camera ISP example, the inputs are the images in
its inputs/ folder (the database), and its batches are in qa/batches.yaml:
# The camera ISP of the K3 robots: a QA-Board demo project, see README.md.
project:
  name: kitefin/camera-isp
  url: https://git.kitefin.example/kitefin/camera-isp
  description: Image pipeline of the K3 camera, from raw sensor data to the displayed image, in float and in the fixed-point model of the camera chip.
  entrypoint: qa/main.py
  reference_branch: main

inputs:
  # relative to this folder: generated charts, downloaded photos, and videos made from them (clips/*.yaml)
  database:
    linux: inputs
    windows: inputs
  globs: ['*.png', '*.tiff', 'clips/*.yaml']
  batches: qa/batches.yaml
Under outputs:, list the files to show, like images side by side with the reference's: see the example's
configuration.
A batch lists inputs and configurations. The example's ci batch runs 9 images in 2 configurations:
# CI: the charts and 4 photos, in good and low light
ci:
  inputs:
  - charts/*.png
  - photos/facade.png
  - photos/backlit-window.png
  - photos/night-street.png
  - photos/sky-gradient.png
  matrix:
    configs: [base, low-light]
The details are in Running your code, Inputs, Metrics and Visualizations.
4. Run and share
Run your code on one input. qa prints your code's log and the metrics, and saves the outputs in output/:
qa run --input <an-input>
<an-input> is the path of one of your inputs, relative to the database folder.
Then run a batch, and send its results to the server with --share:
qa --share batch ci
qa prints a link after Results:: open it to see the commit page, with your runs. Shared results are saved in
/mnt/qaboard, or where storage in qaboard.yaml says.
5. Connect your repository
QA-Board already shows the commits that qa sends results for, with the message and author it reads from git.
Connecting the repository adds the committers' avatars, and lets QA-Board read each pushed commit's qaboard.yaml.
- GitHub
- GitLab
- For a private repository, start the server with a
GITHUB_ACCESS_TOKENthat can read it. For GitHub Enterprise, also list its hostname inQABOARD_GITHUB_HOSTS, or list your hosts inQABOARD_GIT_HOSTS(see Git hosts). Set aQABOARD_WEBHOOK_SECRETtoo (see environment variables). - In the repository's Settings > Webhooks, add a webhook:
- Payload URL:
http://<your-qaboard>/webhook/github - Content type:
application/json - Secret: the server's
QABOARD_WEBHOOK_SECRET - Events: just the push event
- Payload URL:
- Push a commit: GitHub shows a green check next to the webhook's latest delivery.
GitHub has to reach your server for this. When qa has a token, qa batch sets a commit status that links to the
results (step 6), and qa gate --post-status github one that links to the Metrics Diff (step 7).
- Start the server with your
GITLAB_HOSTand aGITLAB_ACCESS_TOKENwith theread_repositoryscope. Set aQABOARD_WEBHOOK_SECRETtoo (see environment variables). - As a maintainer of the project, add a webhook in Settings > Webhooks:
- URL:
http://<your-qaboard>/webhook/gitlab - Secret token: the server's
QABOARD_WEBHOOK_SECRET - Trigger: push events and tag push events
- URL:
- Click Test > Push events: GitLab shows that the hook answered with HTTP 200.
More, and Gitea, Forgejo or Bitbucket, in Project setup.
6. Run in CI
Your CI runs qa batch ci on every push. qa reads the commit and the branch from the CI's environment variables,
and the batch shows as CI on the commit page.
Use a runner that mounts it at the same path as the server: a self-hosted GitHub Actions runner, a GitLab runner or a Jenkins agent on your network. GitHub-hosted runners can't save results yet: they need HTTP upload of outputs.
- GitHub Actions
- GitLab CI
- Jenkins
# Runs your test set on every push, and saves the results to QA-Board.
# qa saves results where the server reads them (e.g. /mnt/qaboard, an NFS share), at the same
# path: use a self-hosted runner that mounts it. GitHub-hosted runners can't reach it yet.
name: QA-Board
on: push
permissions:
  contents: read
  statuses: write  # for qa batch's commit status

jobs:
  qaboard:
    runs-on: self-hosted
    env:
      QABOARD_URL: http://<your-qaboard>
      # qa batch sets a commit status that links to the results
      GITHUB_TOKEN: ${{ secrets.GITHUB_TOKEN }}
    steps:
      - uses: actions/checkout@v4
      - uses: actions/setup-python@v5
        with:
          python-version: "3.12"
      - run: pip install qaboard -r requirements.txt
      # qa reads the commit and the branch from GITHUB_SHA and GITHUB_REF_NAME
      - run: qa batch ci
# Runs your test set on every push, and saves the results to QA-Board.
# qa saves results where the server reads them (e.g. /mnt/qaboard, an NFS share), at the same
# path: the runner must mount it. With the docker executor, add it to the runner's volumes.
qaboard:
  stage: test
  image: python:3.12
  variables:
    QABOARD_URL: http://<your-qaboard>
  script:
    - pip install qaboard -r requirements.txt
    # qa reads the commit and the branch from CI_COMMIT_SHA and CI_COMMIT_REF_NAME
    - qa batch ci
// Runs your test set on every push, and saves the results to QA-Board.
// qa saves results where the server reads them (e.g. /mnt/qaboard, an NFS share), at the same
// path: run it on agents that mount it.
pipeline {
  agent { label 'qaboard' }
  environment {
    QABOARD_URL = 'http://<your-qaboard>'
  }
  stages {
    stage('QA-Board') {
      steps {
        sh '''
          python3 -m venv .venv
          . .venv/bin/activate
          pip install qaboard -r requirements.txt
          # qa reads the commit and the branch from GIT_COMMIT and GIT_BRANCH (Jenkins' git plugin)
          qa batch ci
        '''
      }
    }
  }
}
<your-qaboard> is your server's address. Run CI on your reference branch too: its latest results are what every
other commit is compared with.
7. Compare and gate
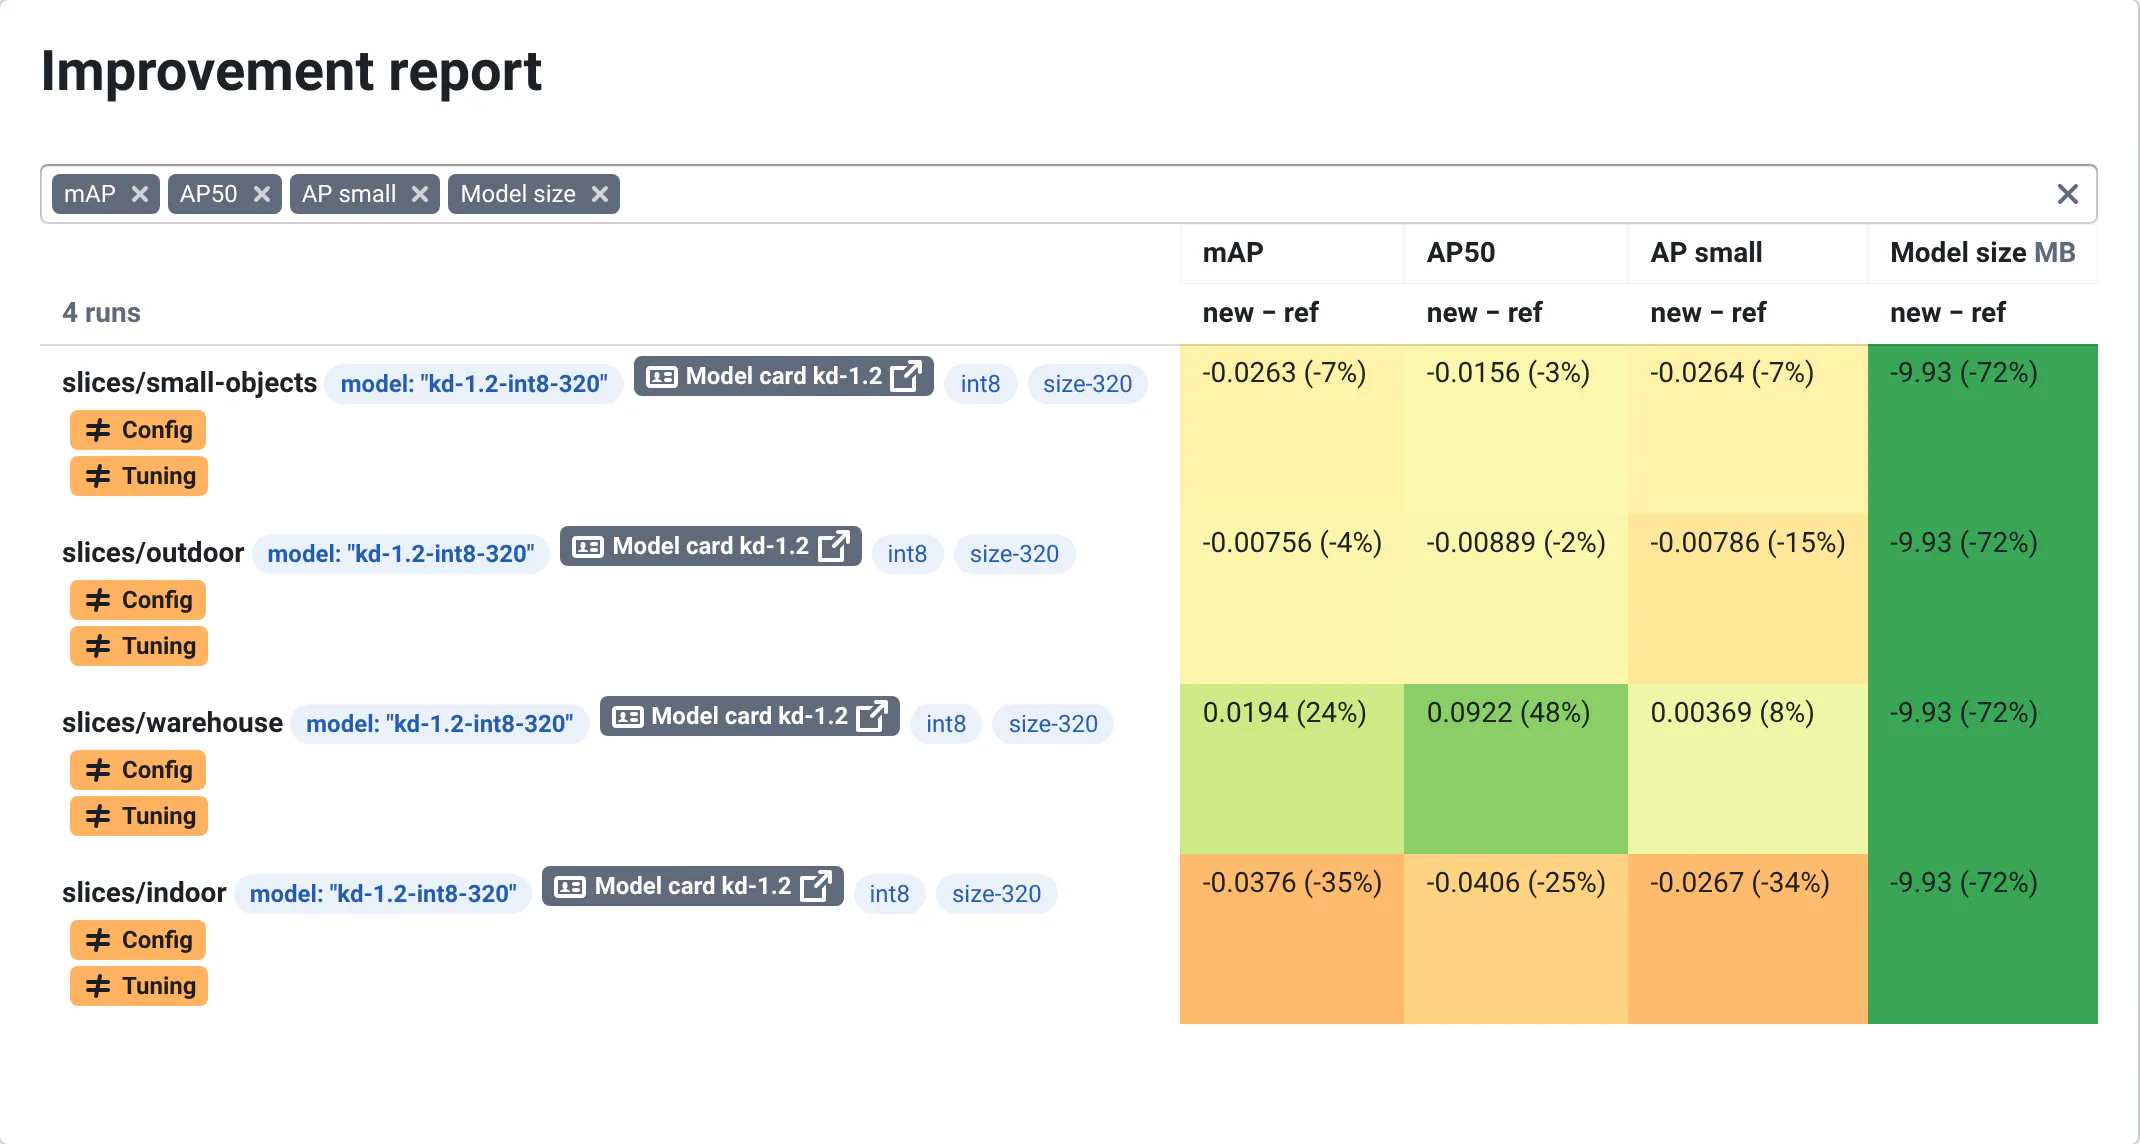
Open a commit from a feature branch: the commit page compares its runs with the latest results of the reference
branch (project.reference_branch in qaboard.yaml). The Metrics Diff view shows how each metric changed, run
by run: green when it got better, red when it got worse. The outputs show side by side. To compare with a release
instead, make it a milestone.
qa gate and the gate: section of qaboard.yaml may change without notice.
To fail CI when quality regresses, add rules under gate: in qaboard.yaml, and run qa gate after qa batch ci.
It compares the commit's metrics with the reference's, and fails the CI job when a rule fails. The camera ISP example
allows PSNR to get at most 1% worse, and the halos 20%:
# Experimental: may change without notice
gate:
  reference: main
  batches: [ci]
  rules:
    - {metric: psnr, max_regression: 1%}
    - {metric: overshoot, max_regression: 20%}
The quality gate page lists the rules, the exit codes and the CI examples.
8. Scale out
By default qa batch runs on the machine where you start it. Other runners send the runs elsewhere: the machines that
run them need the results storage too.
- Local
- LSF
- Dask
- Celery
Run several runs at once on the same machine:
runners:
  default: local
  local:
    concurrency: -1  # one run per CPU
Send each run to an LSF cluster, at most 20 at a time:
runners:
  default: lsf
  lsf:
    queue: <your-queue>
    concurrency: 20
See LSF integration.
Run batches of short runs on a pool of Dask workers, started as LSF jobs or on an existing Dask cluster:
runners:
  default: dask
  dask:
    scheduler_address: tcp://<your-scheduler>:8786
    concurrency: 20
See Dask integration.
Send runs to Celery workers through a message broker, e.g. the RabbitMQ that QA-Board's Docker Compose stack starts:
runners:
  default: celery
  celery:
    broker_url: pyamqp://guest:guest@<your-qaboard-host>:5672//
See Celery integration.
<your-queue>, <your-scheduler> and <your-qaboard-host> are your LSF queue, your Dask scheduler's host and your
QA-Board server's hostname.
Next steps
- QA-Board in 5 minutes: what the web app shows, on a team's demo projects.
- The commit page and Comparing results, to read your results.
- Tuning from the web app, to try parameters on your test set.
- Bit accuracy, to check that outputs didn't change at all.