Software quality: tests and coverage over time
For teams that follow their unit and integration tests in CI dashboards: how many tests there are, which fail, which are flaky or skipped, how much code they cover, and whether that's going the right way. This page follows the fleet SDK example, and shows how to bring any test runner that writes a JUnit XML report.
The example project is examples/software-quality.
The problem
CI says whether the tests passed. It doesn't say that a suite has half the tests it had last week, that the same test fails one run in ten, or that a package is still at 60% coverage a month before the release that promised 85%. Test dashboards plot counts over time, but rarely let you open one commit and see which tests changed status, against which reference, with the failures at hand. And a green CI can hide the worst change of all: tests deleted or skipped to make it green.
Map your tests to runs
A run is a test suite in one configuration, not a test case. A suite is what your CI runs as one command: a test executable, a pytest folder, a CTest label. Its configurations are how you run it: build types, sanitizers, the deprecation warnings that fail the tests in a strict mode. The run's metrics count its test cases, and the test cases themselves are in the run's JUnit XML report, which the test viewer compares with the reference's.
- Inputs are the suites: folders recognized by a file in them (see Recognize inputs inside folders). Configurations are the modes, set in a batch's matrix.
- A failing test doesn't fail the run: the run measured it, and returns
failed: 3. Returnis_failedwhen the suite couldn't run at all, like a crash before any report was written: the gate counts those separately. - Counts add up over suites: pick the sum on the History page to follow all of them together.
Why not one run per test case?
You can: an iter_inputs() function
can list the tests of gtest_project --gtest_list_tests as inputs. It's the right choice when each test takes
minutes and writes outputs worth looking at: a simulation, a hardware-in-the-loop scenario, an end-to-end test with
logs and videos. For unit tests, it isn't:
- Each run is a process. In the example, a run takes about 2 s, most of it starting Python, pytest and coverage.py. Its 609 tests in two modes as 1,218 runs would take 40 minutes of CPU instead of 20 s.
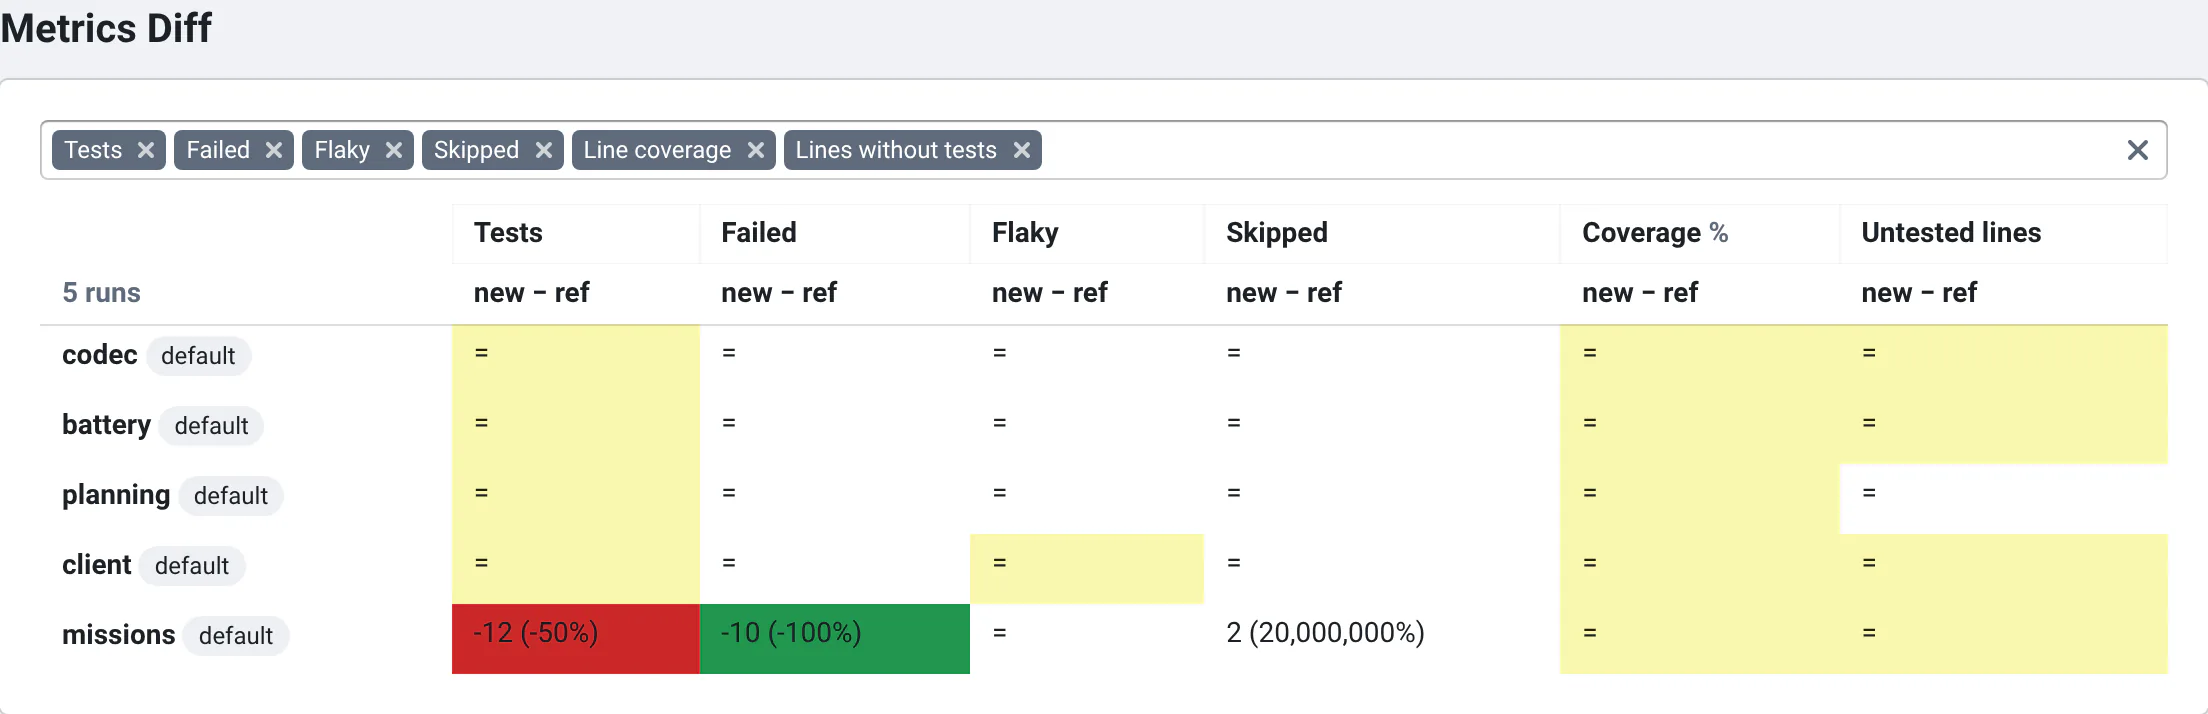
- A run per test makes the commit page a list of pass/fail cards, and the Metrics Diff a table of 0s and 1s. Per suite, the Metrics Diff says "missions: 12 tests instead of 24", and the test viewer says which.
- The database copes either way. A run is one row of the
outputstable, with a few hundred bytes of metrics: the example's 10 runs per commit make 10,000 rows for 1,000 commits. Garbage collection deletes the runs' files after a while, keeps their metrics, and keeps everything on the reference branch and milestones (see Deleting old data).
The example
The Kitefin fleet SDK is what robots and fleet tools use to talk to the fleet backend: a telemetry codec (varints,
CRC-16, frames), A* on a warehouse grid, battery state of charge and range, mission assignment, and a client with
retries and frame handlers. Its tests are in five suites, one per package, run with pytest under coverage.py in two
modes: default, and strict, where deprecation warnings are errors.
For each suite and mode, the example's run():
- runs pytest under coverage.py, which writes a JUnit XML report;
- reads the report: each test case's status, time and failure message;
- runs the tests that failed again, alone: those that pass are flaky, the others failed;
- returns the counts, the coverage of the suite's package and the lines no test runs, and marks the flaky tests in the report.
Its story, over six weeks:
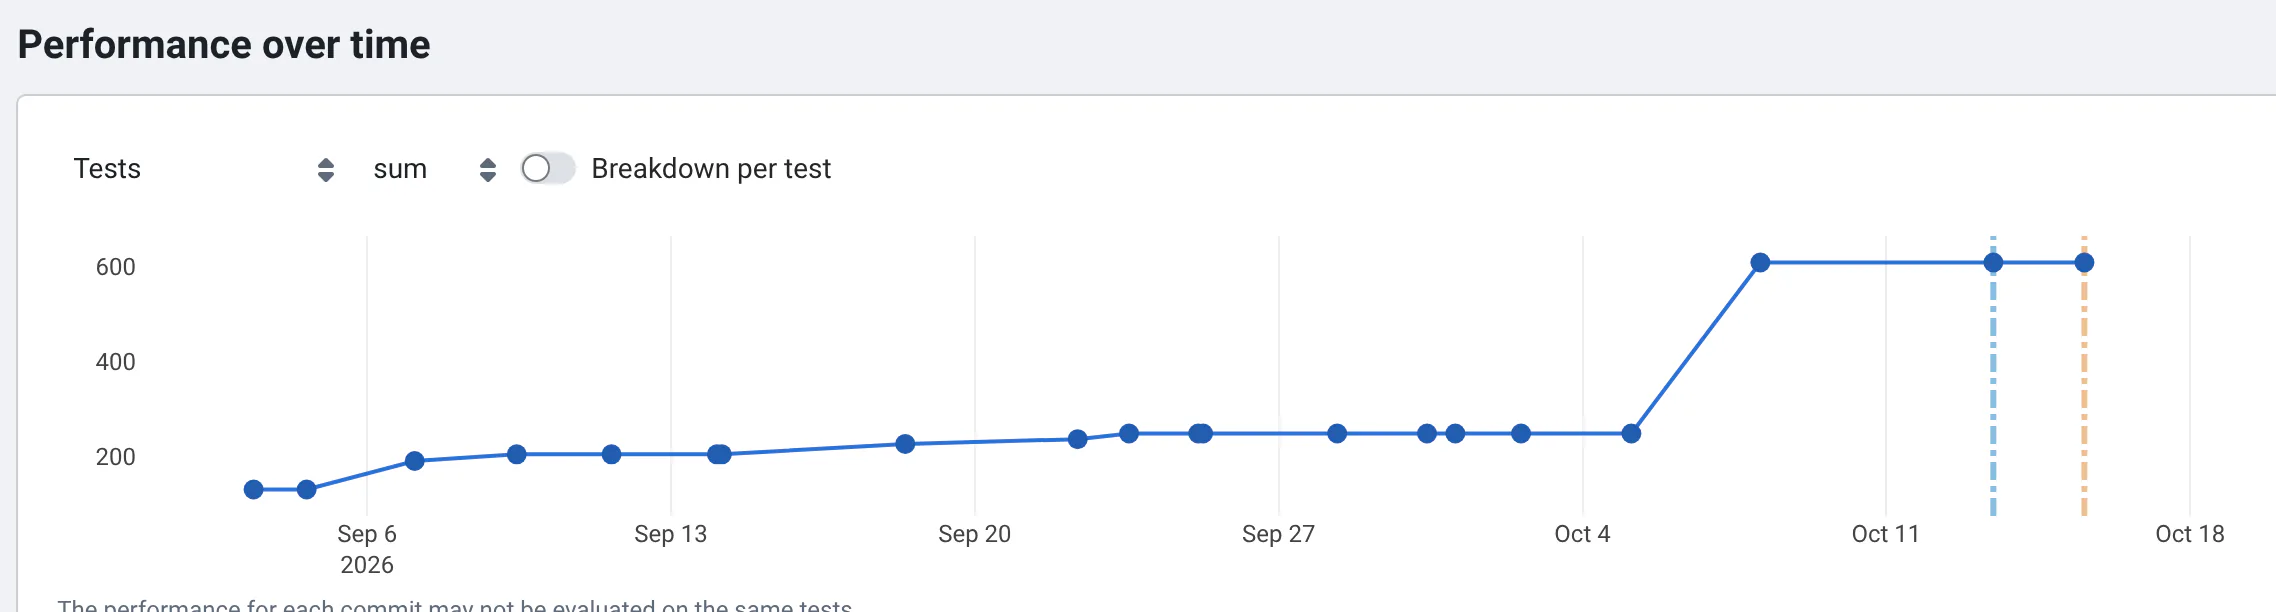
- The platform team targets 85% line coverage in every package for release 1.6. People and the team's coding agent write tests: the number of tests goes from 131 to 249, the lines without tests from 98 to 20.
- An unrolled varint encoder breaks round trips of values over 2^32: 17 codec tests fail, and the codec's coverage goes up, because the buggy fast path runs.
- The agent's registry tests share a global registry: one of them fails after another, and passes alone. It shows as flaky until a fixture clears the registry.
- A call to a deprecated function fails 9 client tests in
strictmode only. - A change to mission assignment ignores the robots' battery reserve, and 10 missions tests fail. Asked to get CI green, the coding agent deletes the reserve tests and skips two others. No test fails, the coverage doesn't move, and the quality gate fails: the missions suite lost 12 tests. The team lead fixes the bug instead.
- 200 fuzz cases per round trip take the codec from 132 tests to 492: the volume jumps, nothing else does.
What you see
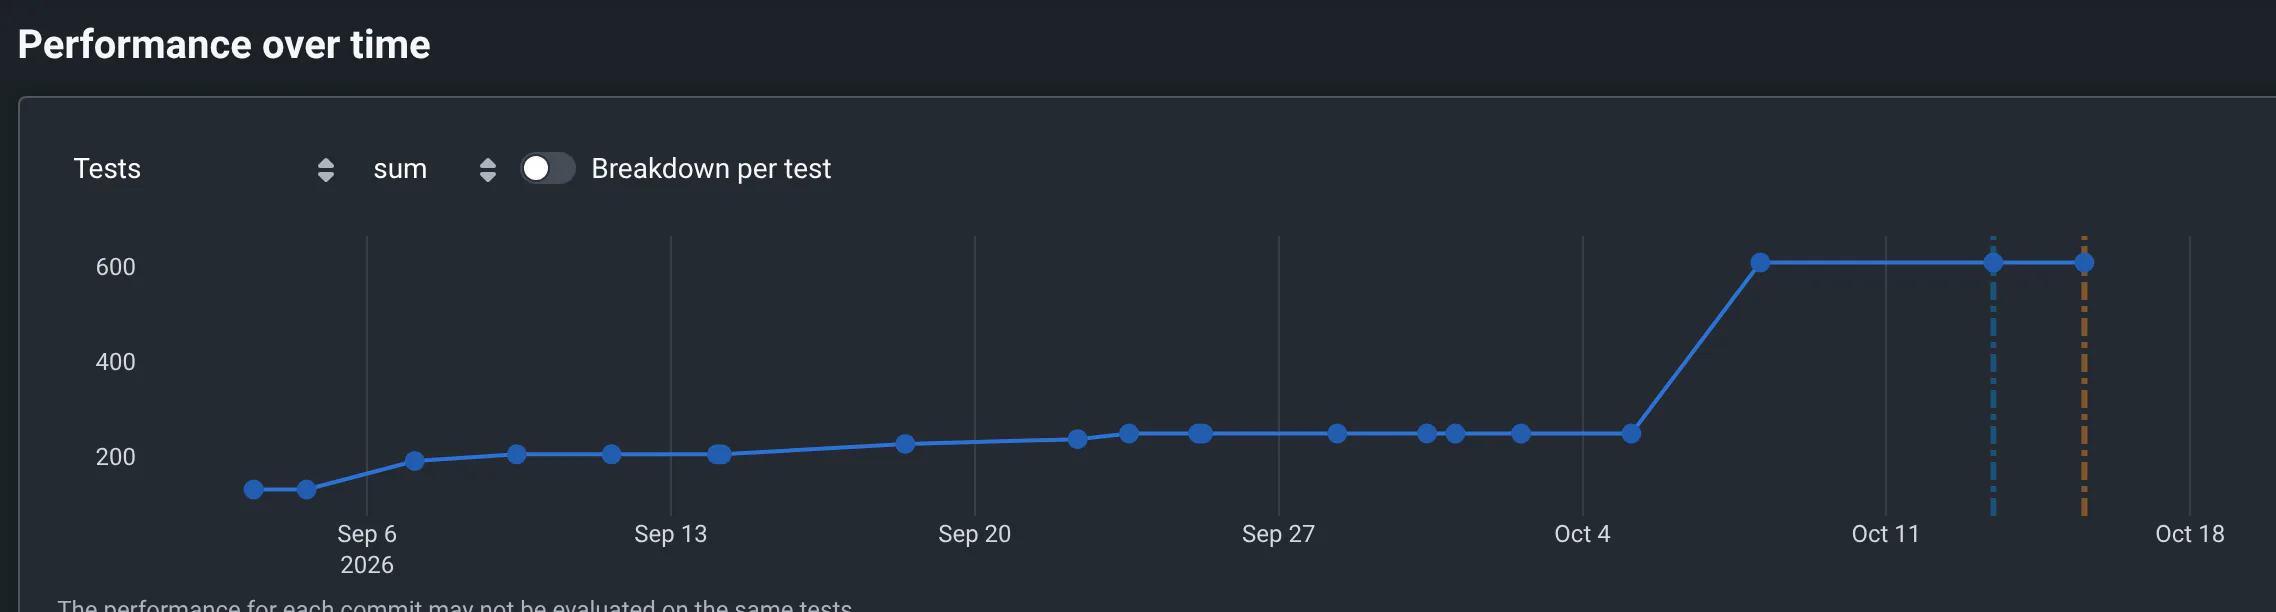
The number of tests over time, added up over the suites: on History, filter on default (strict runs the
same tests), pick Tests, turn off Breakdown per test, and pick sum. With the breakdown on, you see each
suite's line instead.
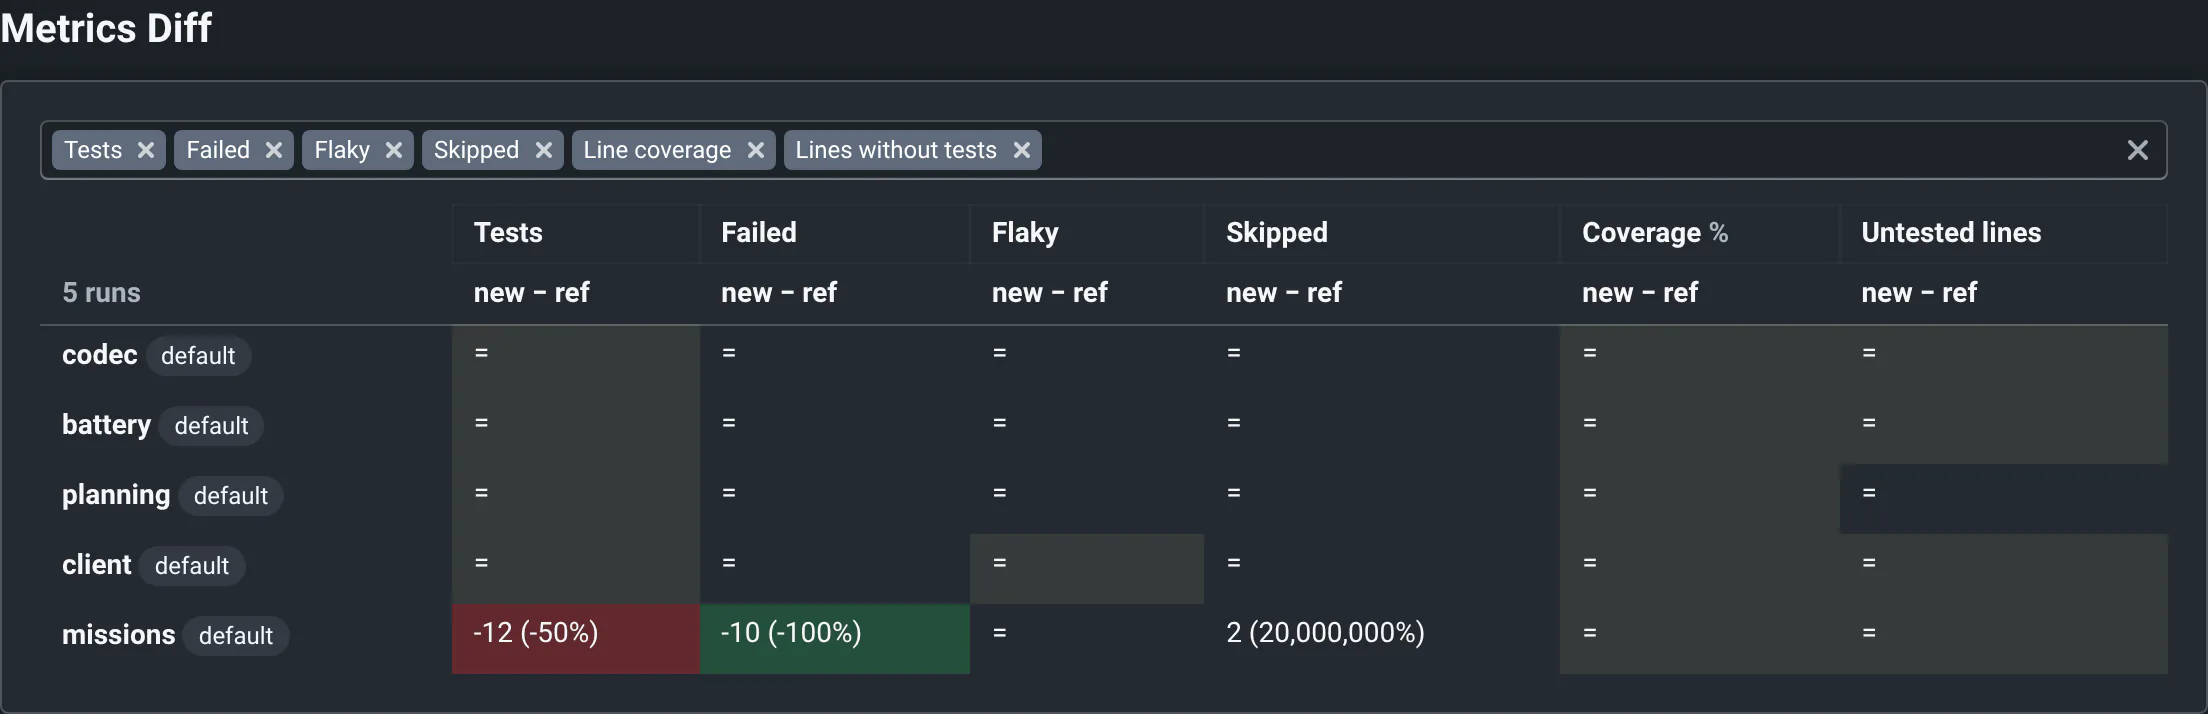
The Metrics Diff of the coding agent's change, suite by suite against main: no test fails any more, because
half of the missions tests are gone. The coverage didn't move: the remaining tests still run the same lines, they
no longer check the reserve.
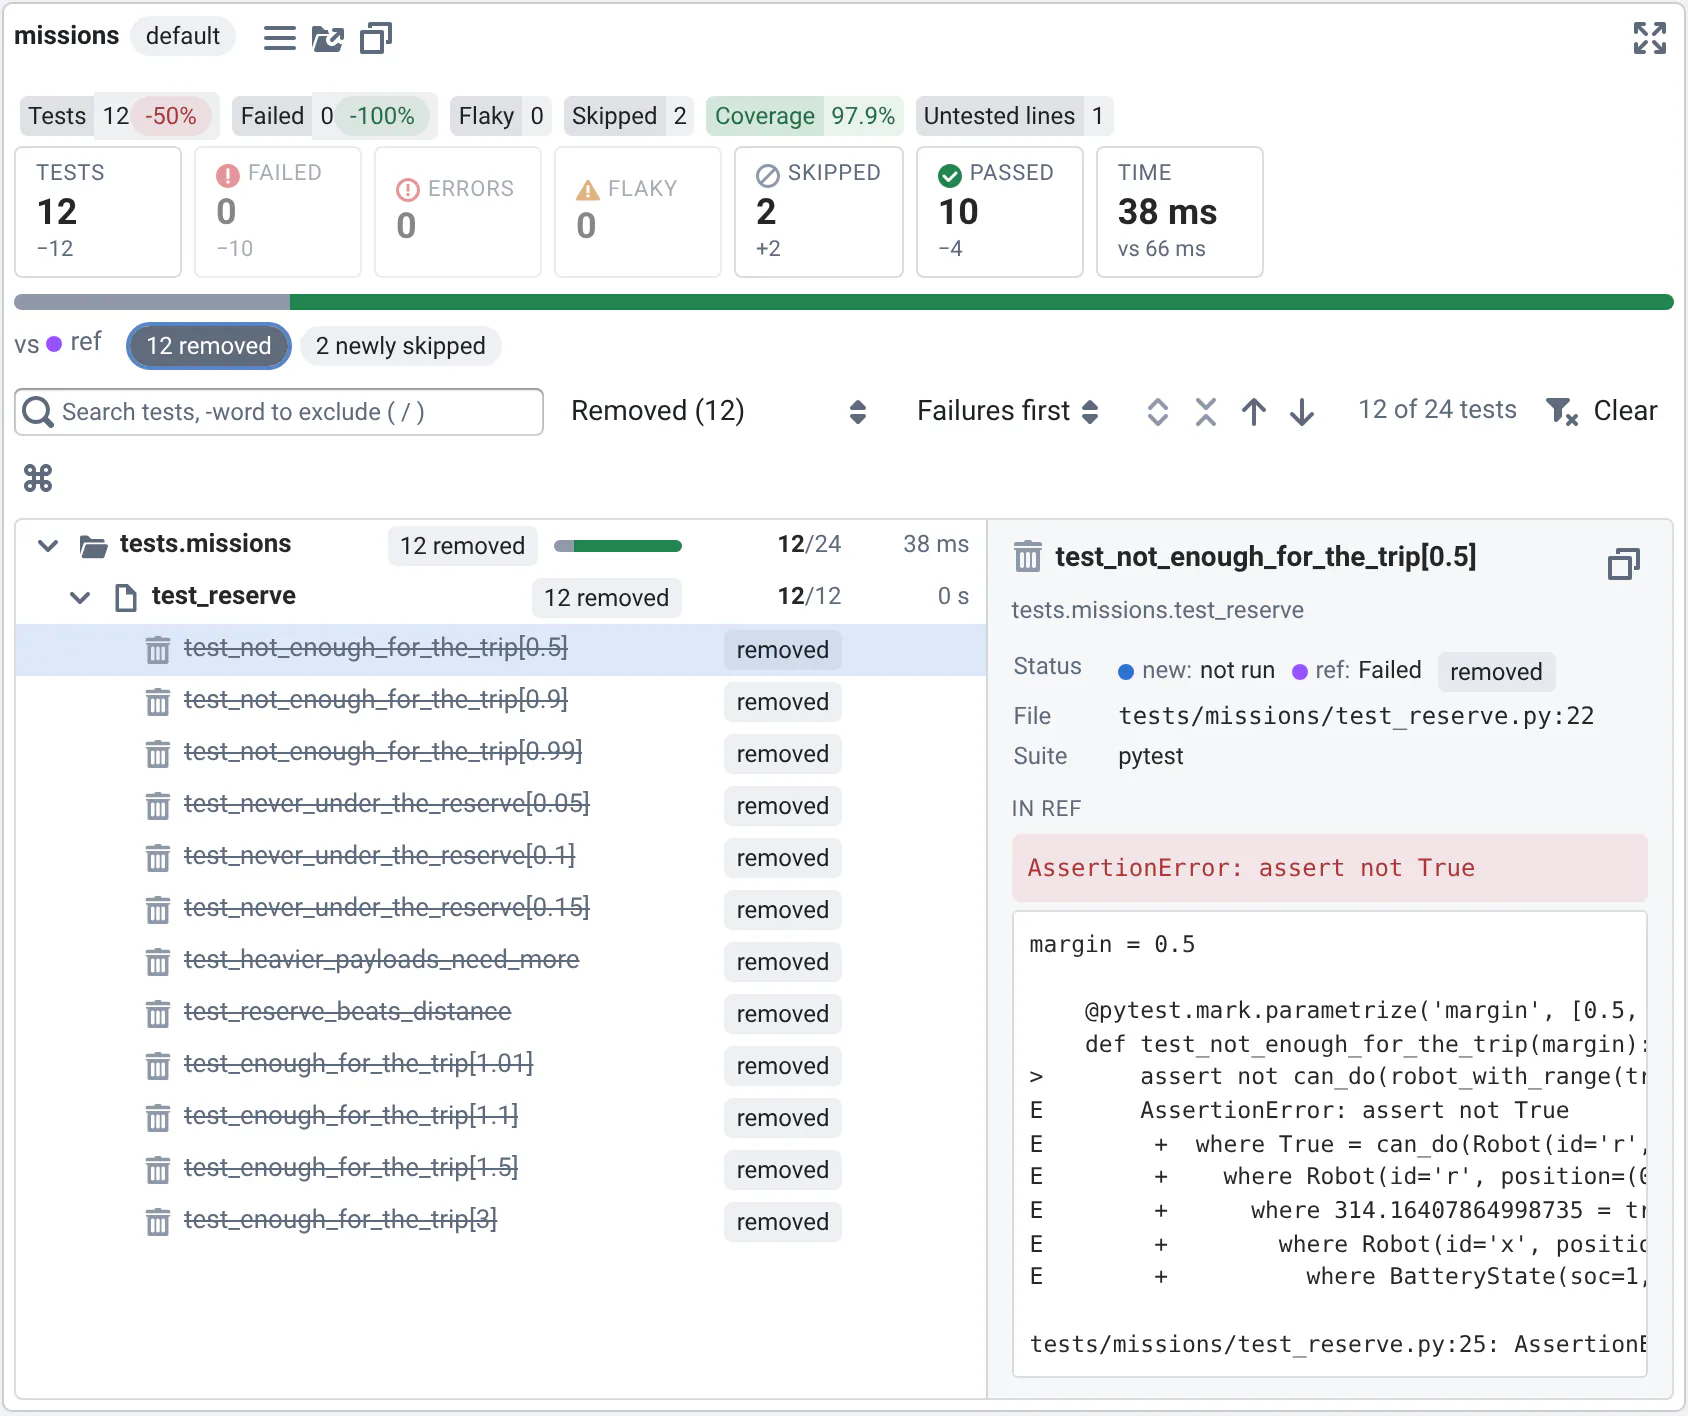
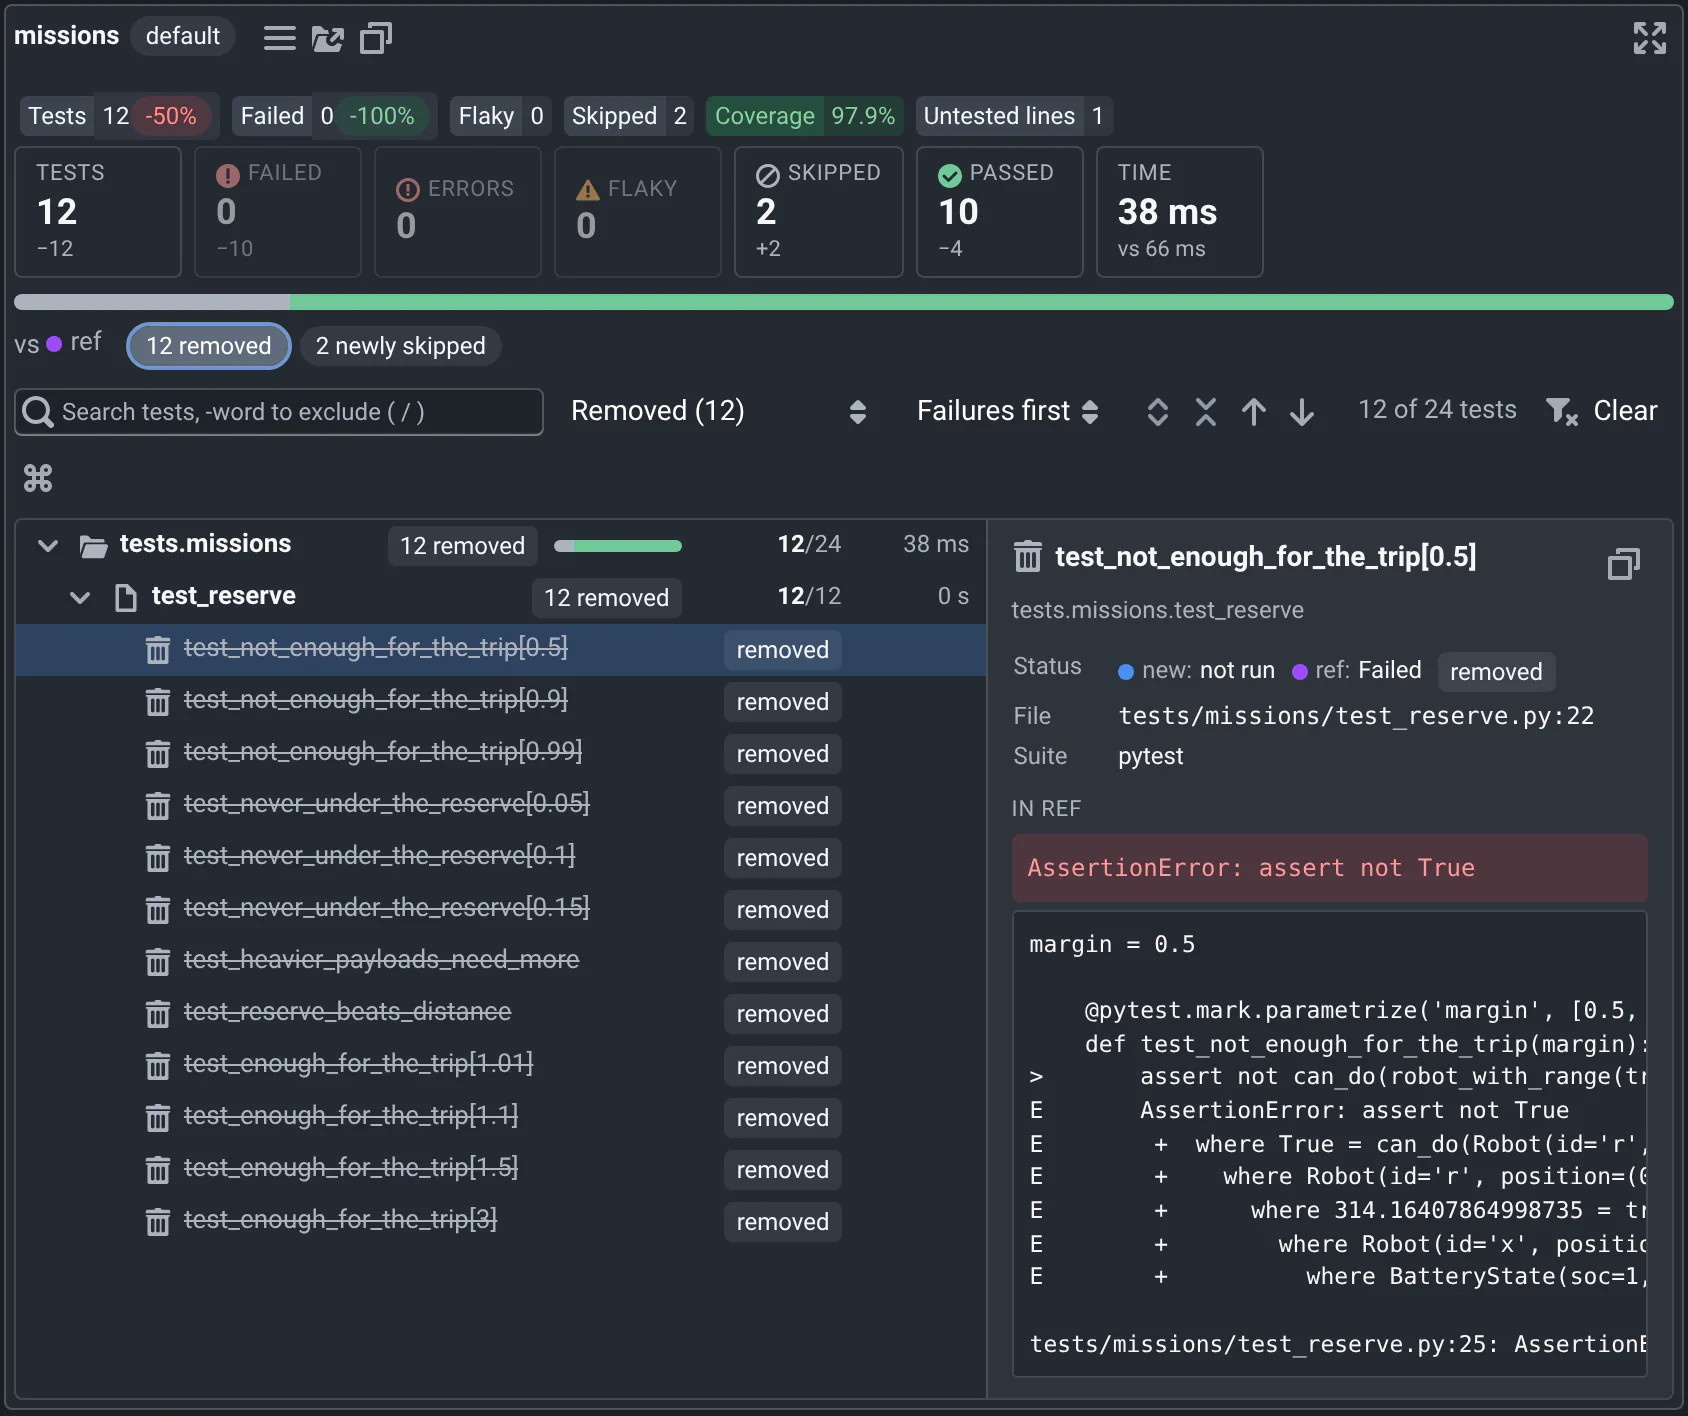
Each suite's tests, against the reference's, in the test viewer: on the agent's change, nothing failing is fixed. Of the missions suite's 10 failing tests, 8 are removed and 2 are skipped; 4 more passing tests are gone. Click a chip to see those tests, a test to see why it failed in the reference, and press n to go from one failure to the next. See Test reports.
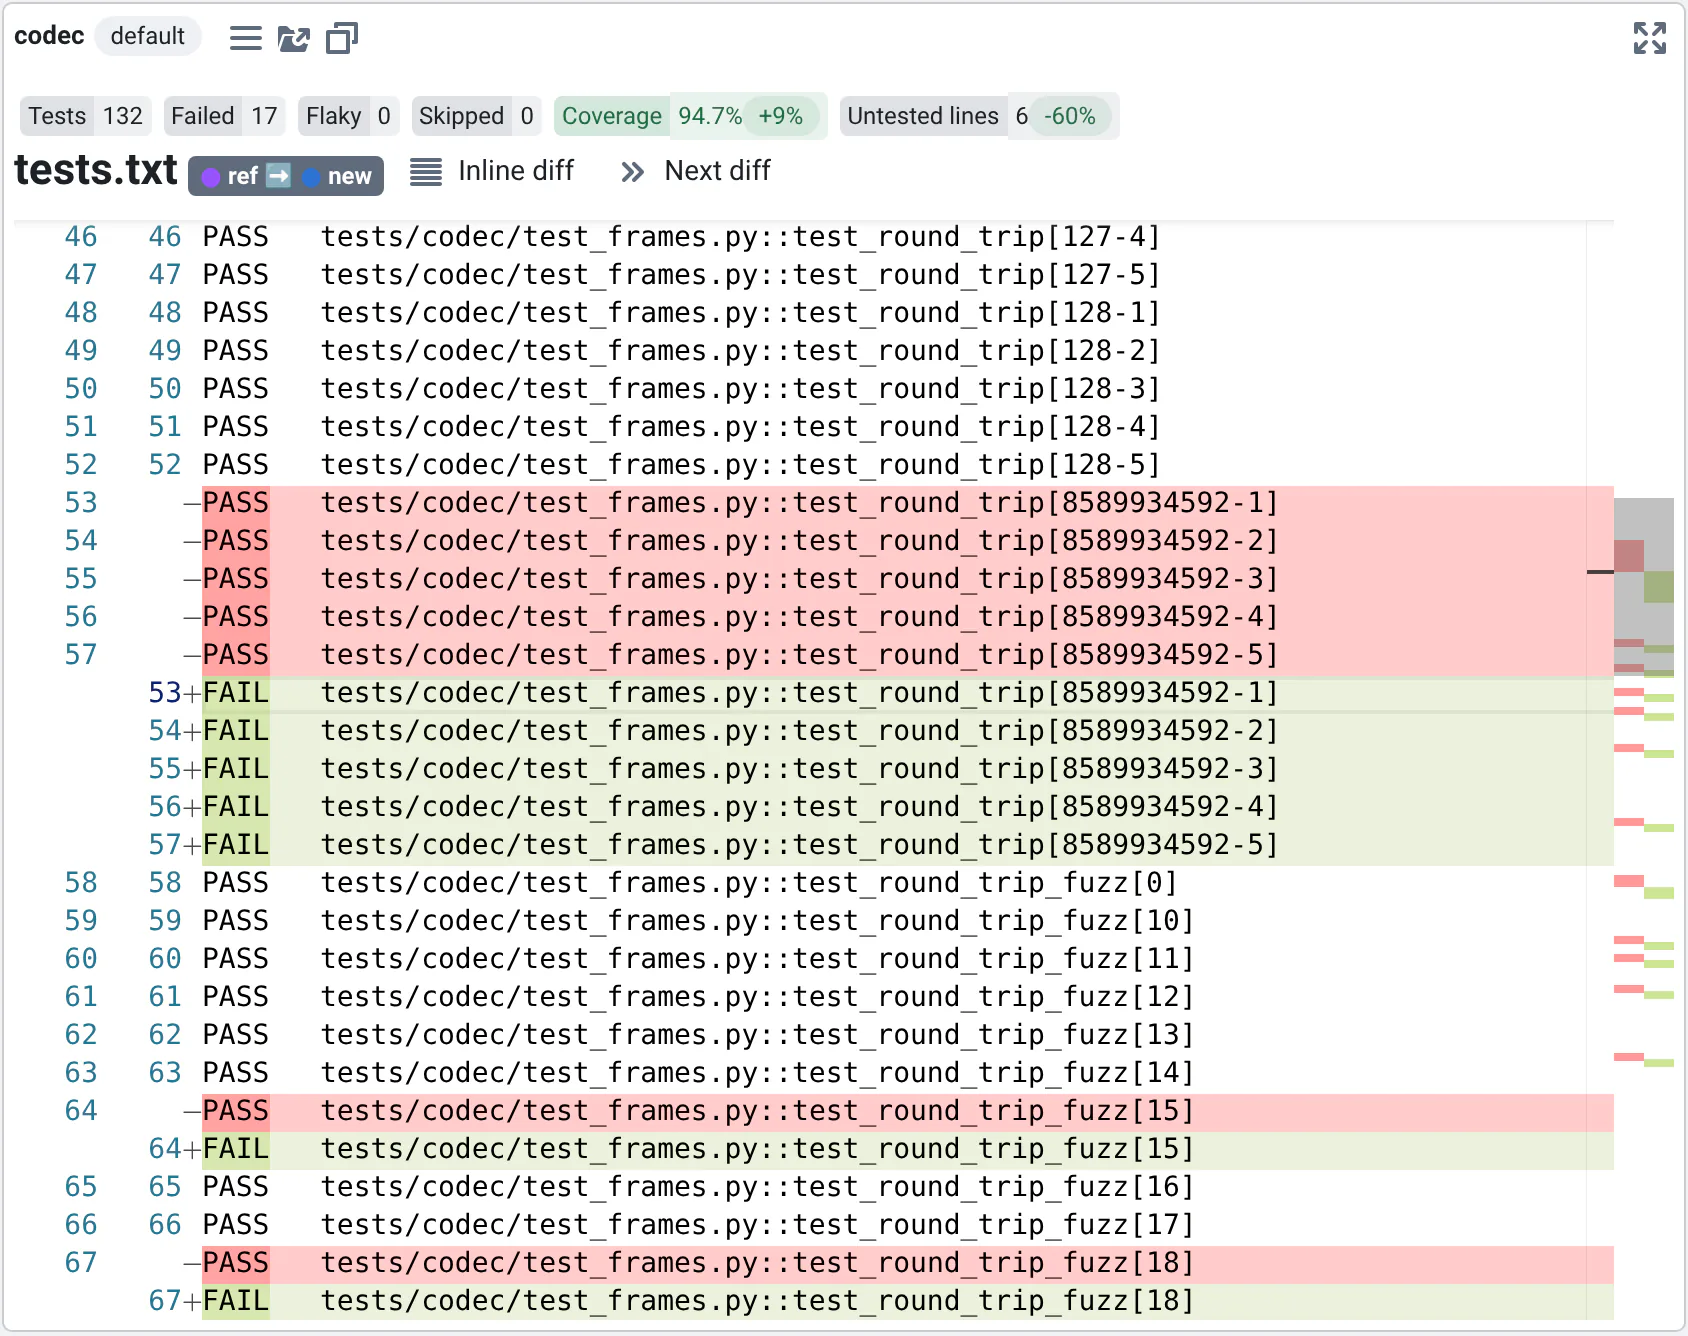
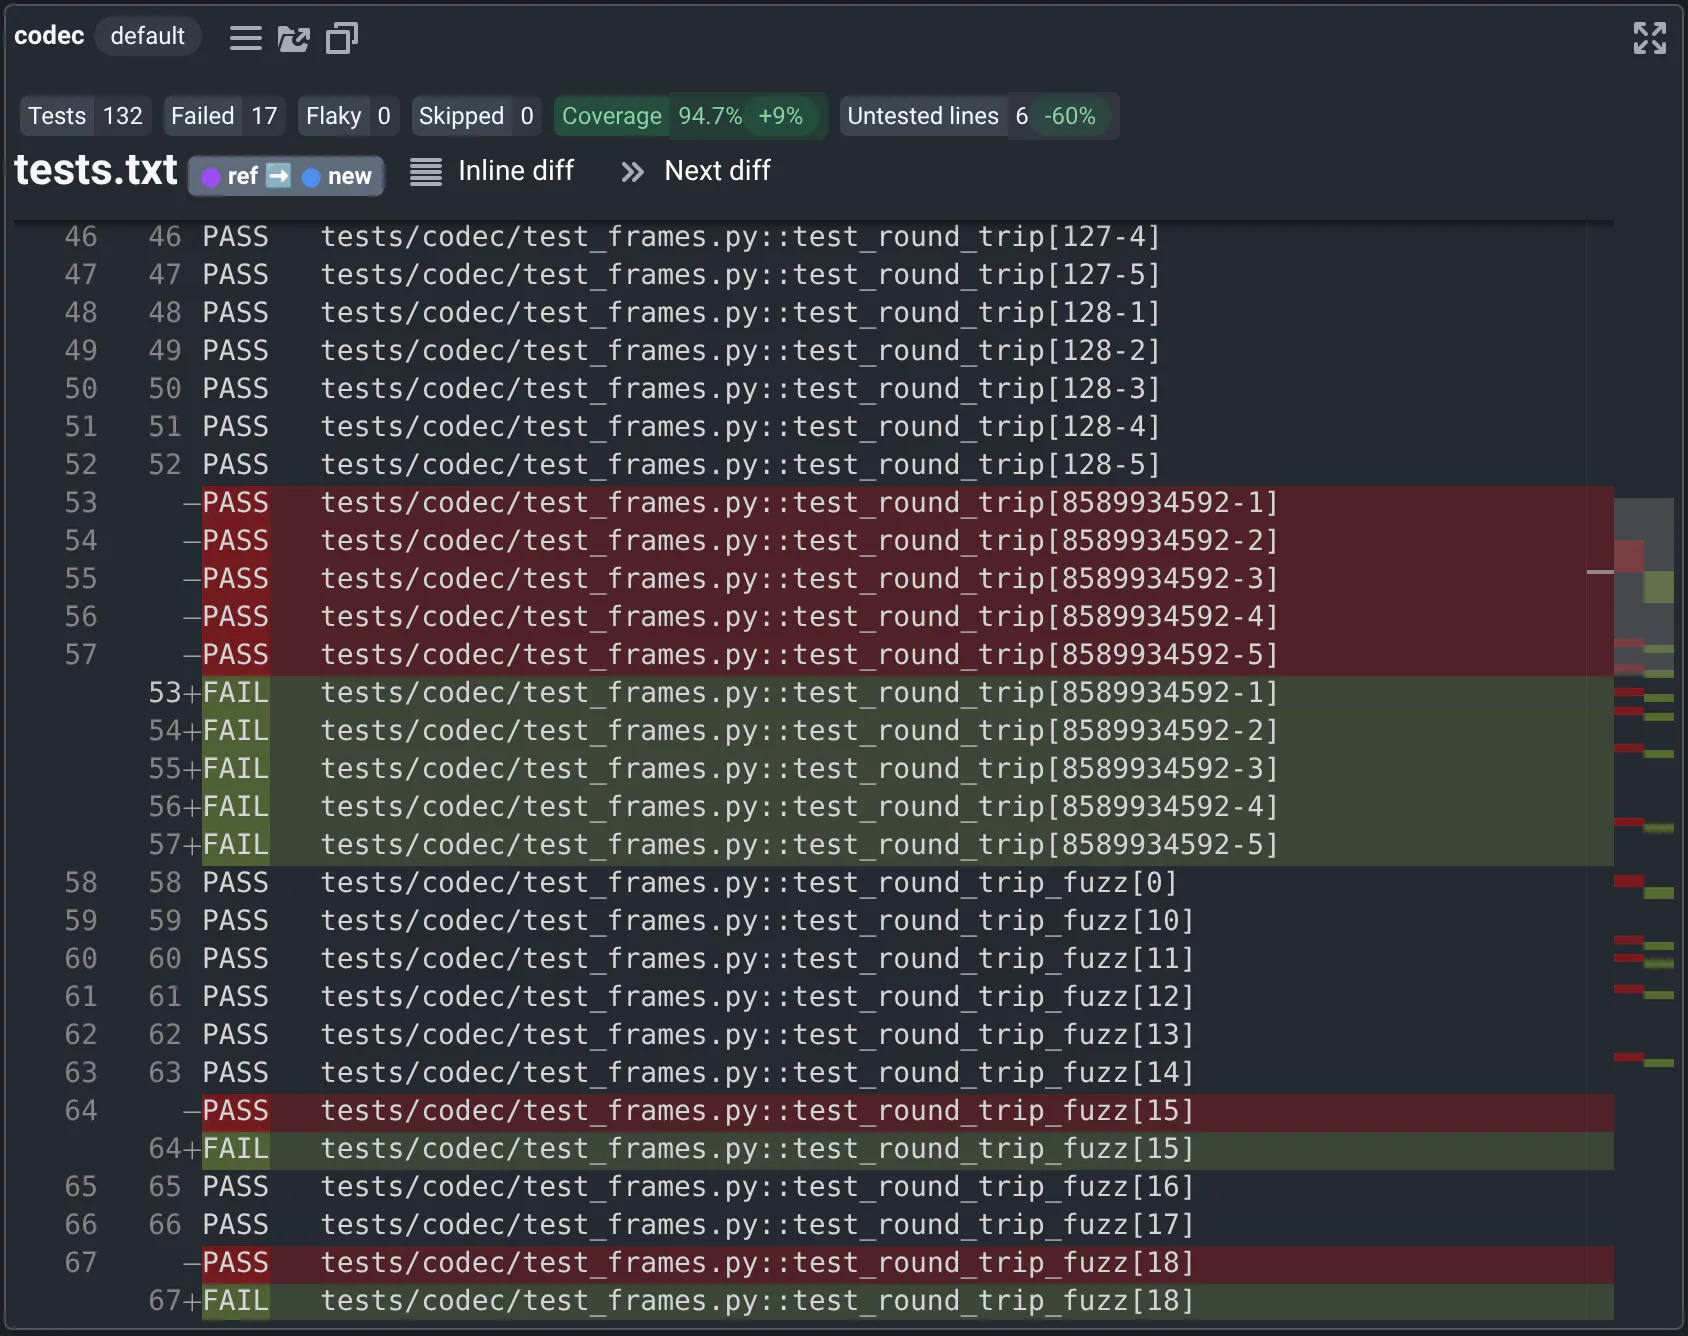
Lines without tests is coverage.py's report, diffed: lines that a commit covers or stops covering show as changes. The example also keeps the list of tests as text, hidden by default: one line per test, its status then its id, which the text viewer diffs.
The quality gate (experimental) fails CI on the agent's change: the missions suite has fewer tests and more skipped tests than its reference run.
# Experimental: may change without notice
# Each run is one suite in one mode. A failed test doesn't fail the run: the run measured it. Runs fail when the
# suite couldn't run at all (max_failed_runs).
gate:
  reference: main
  batches: [ci]
  rules:
    - {metric: failed, max: 0, aggregate: max}          # no suite has a failing test (flaky ones are reported, not gated)
    - {metric: errors, max: 0, aggregate: max}          # nor errors in fixtures or collection
    - {metric: tests, per_test_max_regression: 0%}      # no suite loses tests
    - {metric: skipped, per_test_max_regression: 0%}    # nor skips more of them
    - {metric: coverage, per_test_max_regression: 2%}   # nor loses more than 2% of its coverage
  max_failed_runs: 0
failed uses aggregate: max, so that one failing test in any suite fails the gate; a median over the suites would
hide it. Flaky tests are reported, not gated: gate on them once you have none. See
Quality gate for the rules.
The configuration
Each suite is a folder of tests/, recognized by its suite.yaml: the package whose coverage it measures, a label
and tags. The visualizations are the files each run writes.
inputs:
  # relative to this folder: each suite is a folder of tests, tests/<suite>/, recognized by its suite.yaml
  database:
    linux: tests
  globs: suite.yaml
  use_parent_folder: true
  batches: qa/batches.yaml

outputs:
  metrics: qa/metrics.yaml
  style:
    width: 840px
  visualizations:
    - name: Tests
      path: junit.xml              # pytest's JUnit XML report: QA-Board's test viewer compares it with the reference's
      height: 440
    - name: Lines without tests
      path: coverage.txt           # coverage.py's report: per file, the lines and branches no test runs
    - name: Test list
      path: tests.txt              # one line per test, its status then its id, as text: diffed
      max_lines: 30
      renderSideBySide: false      # inline: the ids are long
      default_hidden: true
    - name: Slowest tests
      path: slowest.plotly.json
      side_by_side: false
      default_hidden: true
    - name: HTML report
      path: report.html            # the same tests, in a report our code writes: what a run can show without a viewer
      default_hidden: true
The metrics say which way is better, so that the web app colors changes and the gate knows a regression. Coverage has a target, so the Summary shows the share of runs that reach it.
# yaml-language-server: $schema=https://samsung.github.io/qaboard/metrics.schema.json
# Metrics returned by run() in qa/main.py, for one suite in one mode. Counts add up over the suites: on the History
# page, pick **sum** to follow the whole SDK (filtered on one mode, else each test counts twice).
default_metric: tests
summary_metrics: [failed, flaky, skipped, tests, coverage, lines_missed]
main_metrics: [tests, failed, flaky, skipped, coverage, lines_missed]
dashboard_evolution_metrics: [tests, failed, flaky, skipped, errors, coverage, branch_coverage, lines_missed, test_time]

available_metrics:
  tests:
    label: Tests
    description: Test cases collected, skipped ones included. More isn't always better, but fewer means some were deleted.
    smaller_is_better: false
    precision: 4
  failed:
    label: Failed
    description: Tests that failed, and failed again when run alone.
    smaller_is_better: true
    target: 0
    target_passfail: true
  coverage:
    label: Line coverage
    short_label: Coverage
    description: Lines of the suite's package that its tests run (coverage.py). The SDK 1.6 target is 85% in every package.
    suffix: '%'
    scale: 100
    smaller_is_better: false
    target: 0.85
  lines_missed:
    label: Lines without tests
    short_label: Untested lines
    description: Lines of the suite's package that no test runs. The packages don't overlap, so their sum is the SDK's.
    smaller_is_better: true
The example's qa/junit.py
reads the JUnit XML reports of pytest, GoogleTest (--gtest_output=xml:junit.xml), CTest (--output-junit) and
Maven Surefire, which reports flaky tests itself, to compute the metrics. It uses the standard library only: copy it,
and change the command that qa/main.py runs. The test viewer reads the same reports.
Other quality metrics
Test counts are the start. Return any number your tools compute, and declare which way is better (Declaring metrics):
| Metric | Where it comes from | How to follow it |
|---|---|---|
| Failed, errors | JUnit XML reports | A gate rule with max: 0 and aggregate: max. |
| Flaky tests | Rerunning the failures alone; Surefire's rerunFailingTestsCount, Bazel's --flaky_test_attempts | Count them per suite, and list them in the report. Gate on them once there are none. |
| Skipped and disabled tests | JUnit XML (<skipped>, GoogleTest's DISABLED_ tests) | A rising count hides failures: per_test_max_regression: 0%. |
| Line and branch coverage | coverage.py, gcov or llvm-cov, JaCoCo | Per package, with a target. Also return the lines without tests: their sum is the project's, where percentages don't add up. |
| Coverage of the changed lines | diff-cover against the reference branch | Per commit: "the lines this change added are 40% covered". |
| Mutation score | mutmut, Stryker, PIT, Mull | Expensive: in a nightly batch, per package. It says whether tests check the code they run, which coverage doesn't. |
| Test time, slowest tests | JUnit XML times | Per suite, and a plot of the slowest tests with the reference's overlaid. |
| Warnings and static analysis findings | The compiler's log, clang-tidy, ruff, cppcheck (SARIF) | Counts per category: per_test_max_regression: 0% keeps them from growing. |
| Sanitizer and Valgrind errors | A configuration of the suites built with ASan, UBSan or TSan | Counts per suite, like failed tests. |
| Build time, binary size | The build | A run per target, a configuration per build type. |
| Fuzzing | libFuzzer, AFL, Hypothesis | A nightly batch with a time budget: crashes found, corpus coverage. |
Counts (tests, findings, lines without tests) add up over suites: follow them with the sum. Rates (coverage, pass rate) don't: follow each suite's, or return the counts they come from.
What QA-Board doesn't do (yet)
- No history of a single test case. The test viewer compares a run with its reference. To follow one test across commits, follow its suite on History, or make it a run of its own.
- No ratios of sums. The project's line coverage is
1 - sum(lines without tests) / sum(lines): plot its parts, or add a run that measures coverage over all the tests, in a batch of its own. - Targets apply to each run. A target of 85% coverage is each suite's. A goal for the total, like "1,000 tests by the release", is read on the sum's line: QA-Board doesn't draw it.
Run this example
You need Python 3.11 or later.
pip install qaboard pytest coverage
cd examples/software-quality
qa run --input missions     # one suite, about 2 s
qa batch ci                 # 5 suites in 2 modes, about 20 s
Without --share, results stay in output/. To see them in the web app, run qa --share batch ci. With the
quickstart's server, first
export QABOARD_URL=http://localhost:5151 QA_STORAGE=/tmp/qaboard.
To see the story's bugs, write its flags, e.g. echo '{"bug_missions_reserve": true}' > build/flags.json, and run
the suite again: see the example's
README.
Read more
- Test reports: the files the test viewer reads, and how to write them.
- Text and HTML reports: the other viewers the example uses.
- History: metrics across commits, per test or aggregated.
- Quality gate: fail the CI on regressions.
- CI integration: run
qa batchin your CI.