Serving latency: an inference gateway
For backend and performance engineers, and for anyone who reviews "it's faster" claims, including the ones coding agents make. This page follows the inference gateway example.
The example project is examples/serving-latency.
Its screenshots show as placeholders until they're captured.
The problem
Latency is a distribution, not a number. A change can save CPU, or make the median faster, and still make the tail much slower, and the tail is what users and timeouts see. Measurements are noisy, so one run proves little: you need repeats, the same load profiles on every commit, and a way to see where the time went.
The example
A small inference gateway, in Rust: a request queue, dynamic batching, a pool of workers running a CPU model, and a result cache. An open-loop load generator sends it requests at a fixed rate, with steady, bursty, heavy-tailed and ramping profiles. Each run measures the latency percentiles from p50 to p99.9, throughput, CPU per request, and how long requests waited in the queue, for a batch or for a lock, and records CPU samples for a flame graph.
Its story:
- The team's coding agent adds a shared result cache. Its commit message says it saves CPU, and it does, about a third per request. But the workers keep the cache's one lock while they run the model and render responses, so the server does one batch at a time. Its capacity halves: at 6,000 requests/s, requests queue for the lock and wait seconds. The quality gate fails.
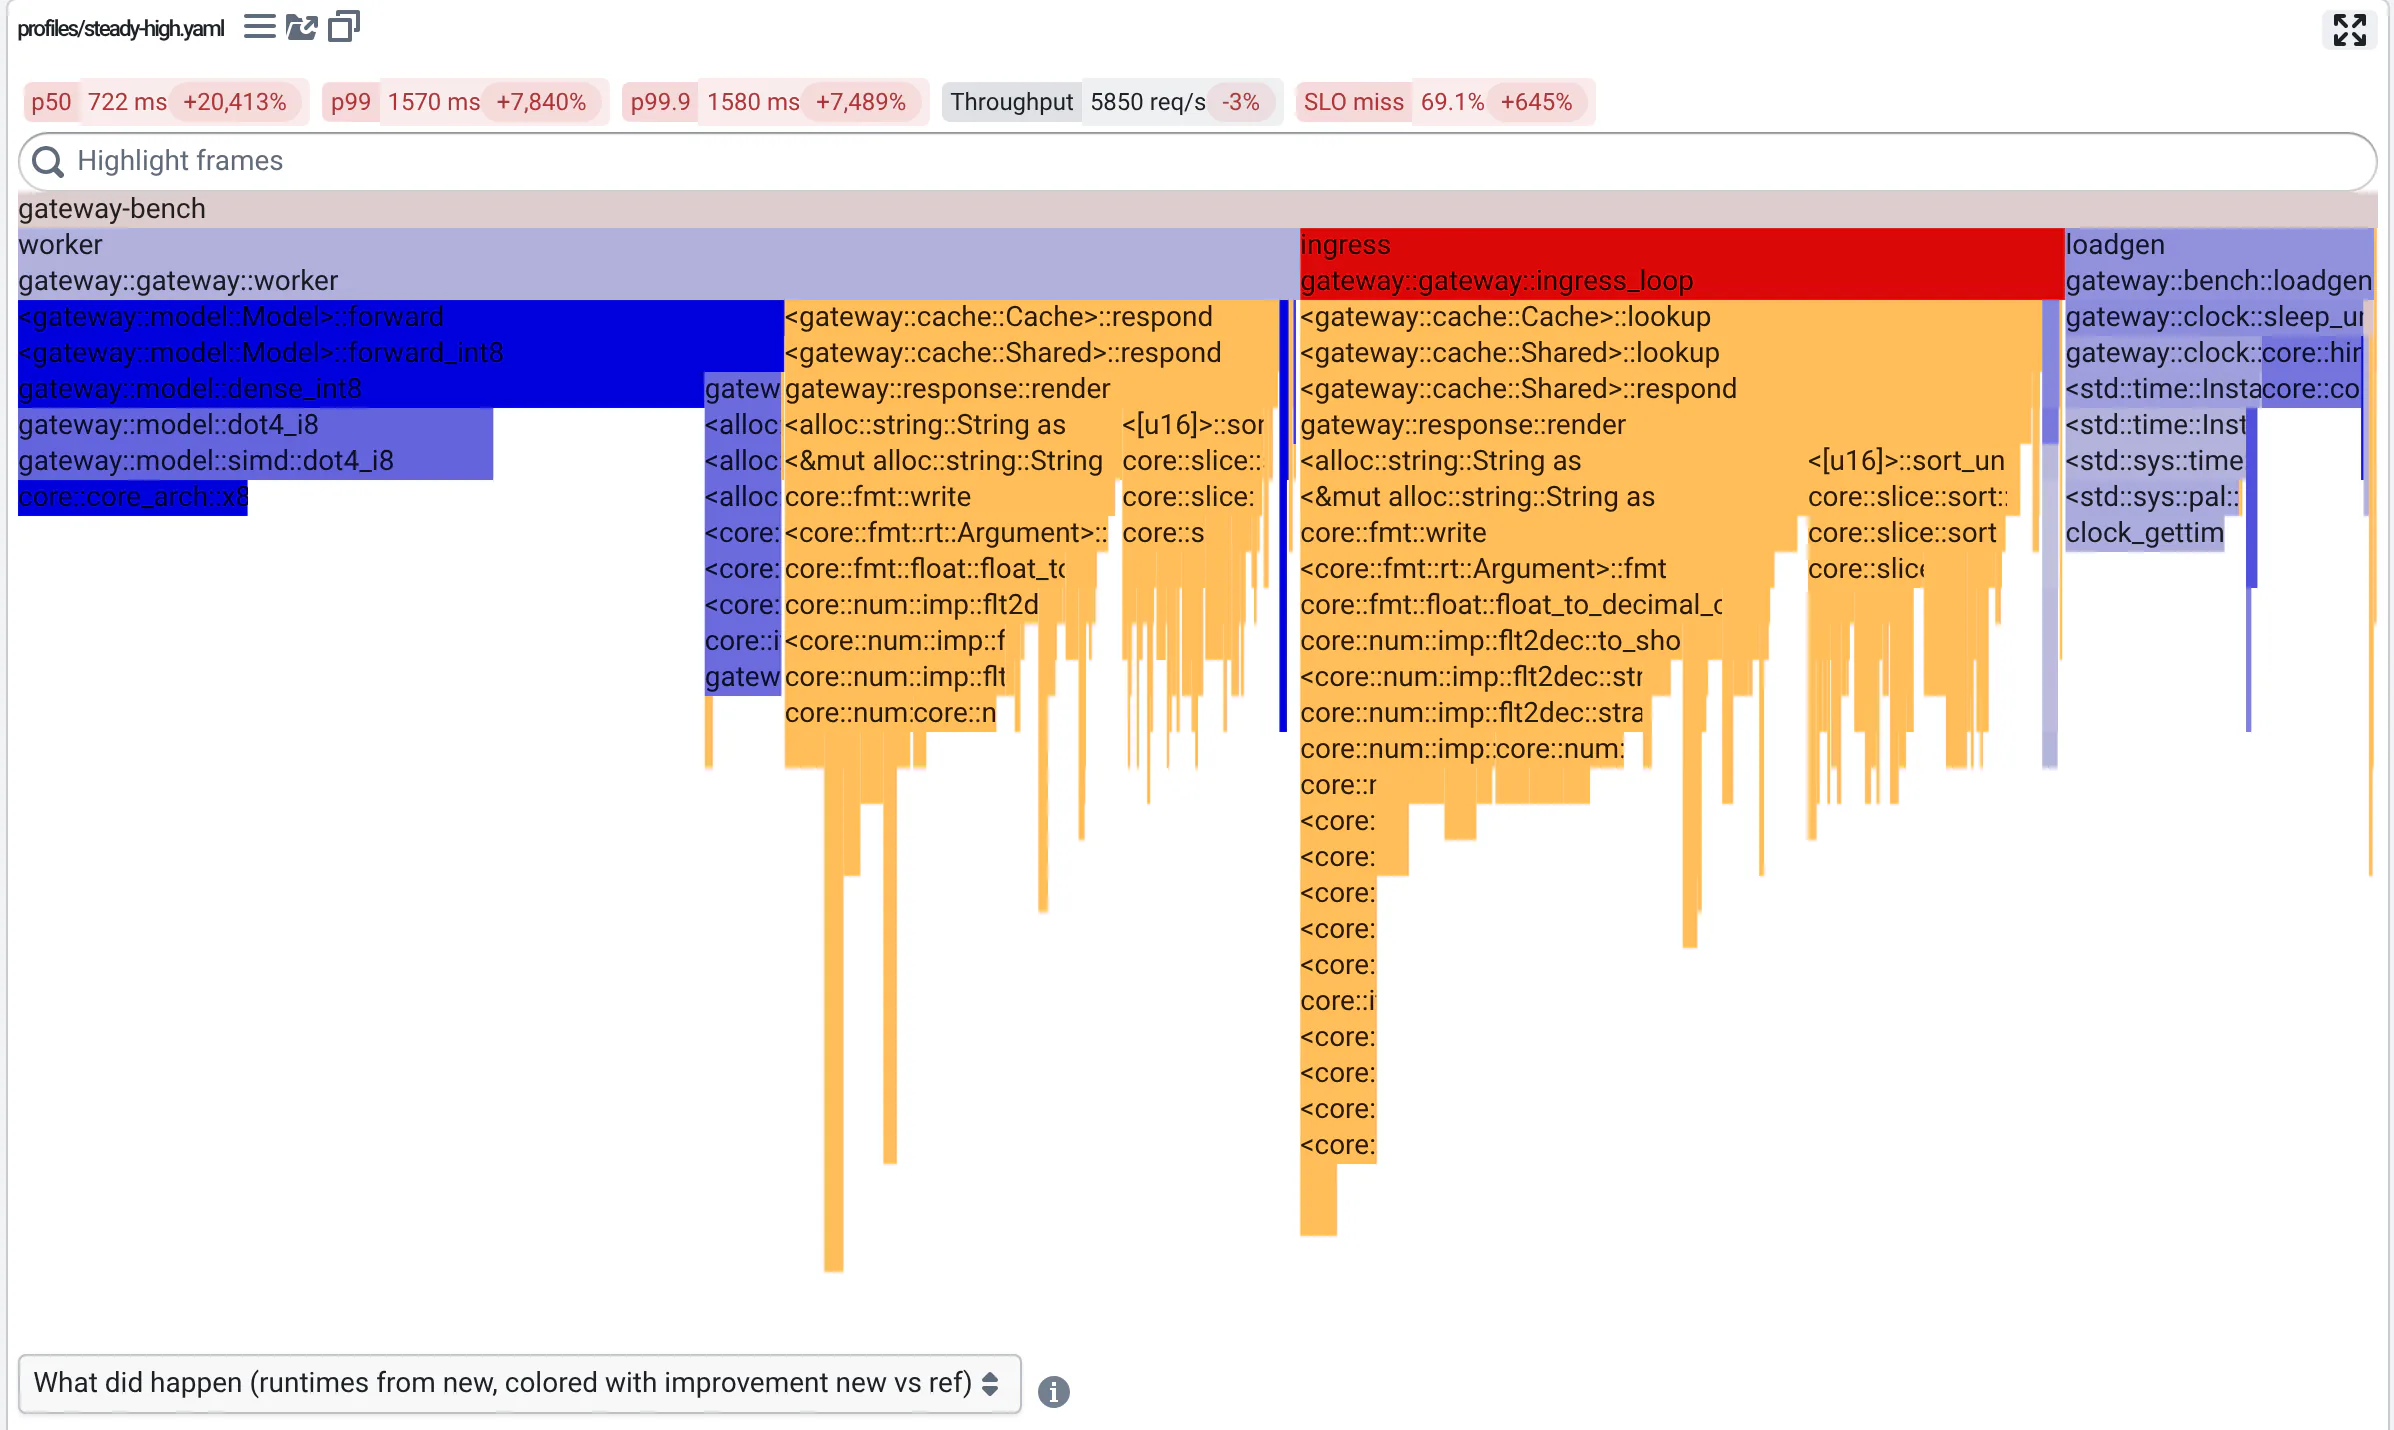
- The flame graph diff shows the responses rendered under the cache's lock, and the model work the cache saves.
- Sharding the cache by key fixes p99 and makes the median faster. A tuning sweep then picks the batching settings.
- Later, a commit that copies payloads makes p99 worse on the heavy-tailed profile only: the median over all profiles barely moves, and History finds it.
What you see
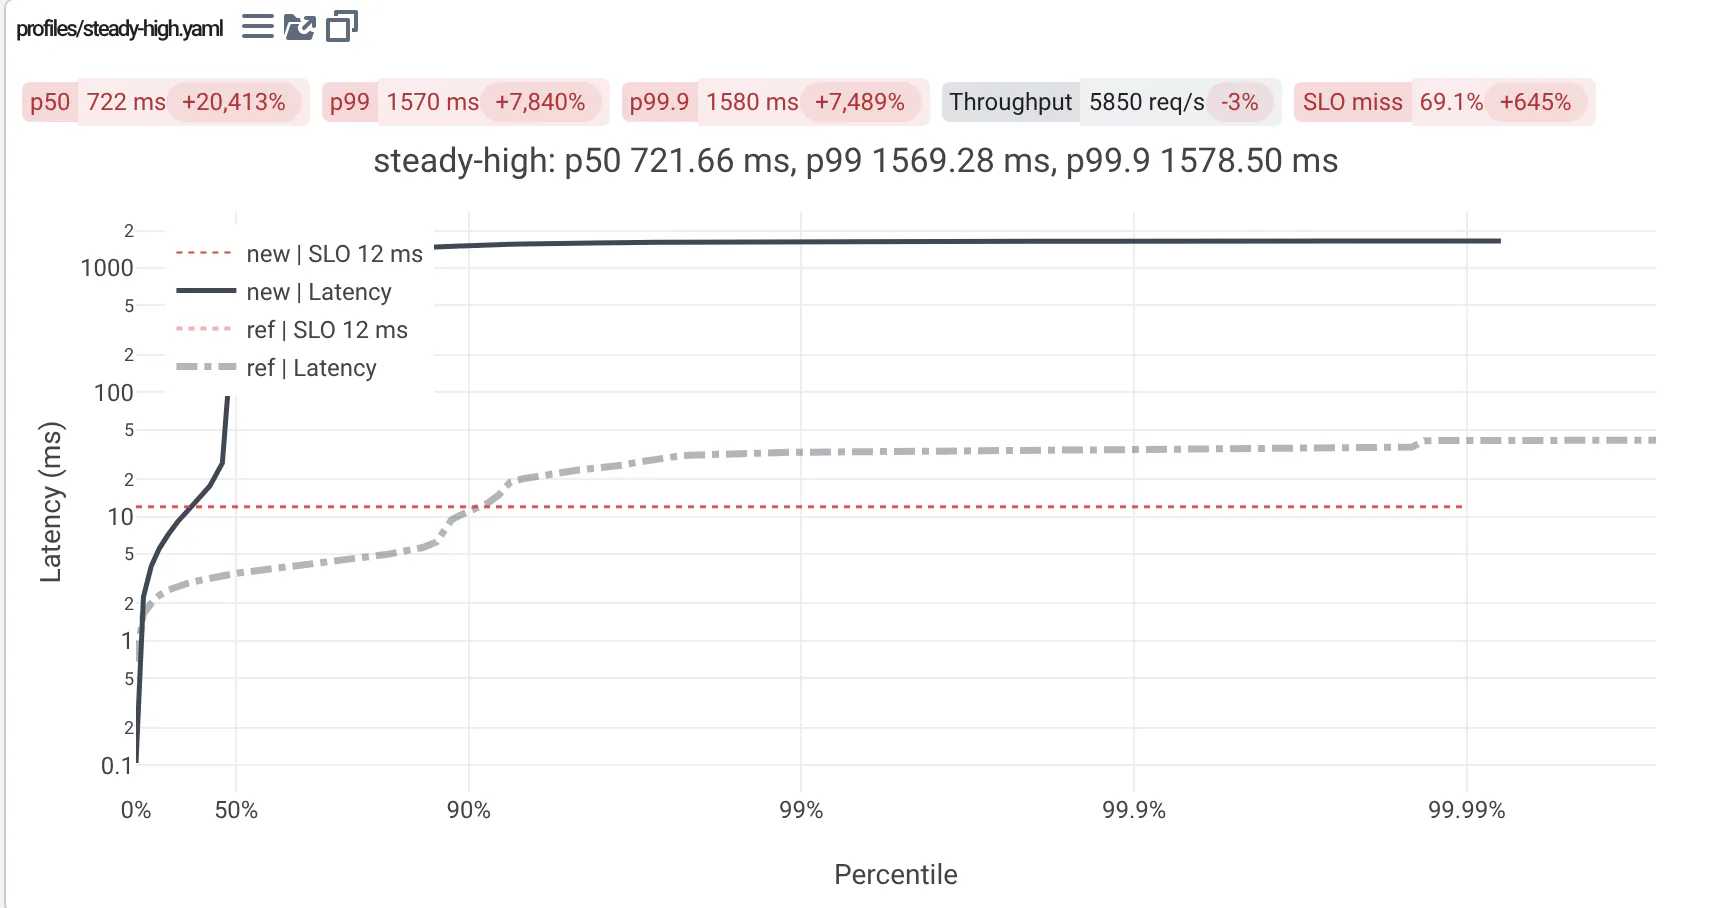
Latency percentiles on a log scale, new over the reference: at 6,000 requests/s, with the shared cache, every percentile is a hundred times slower or more.
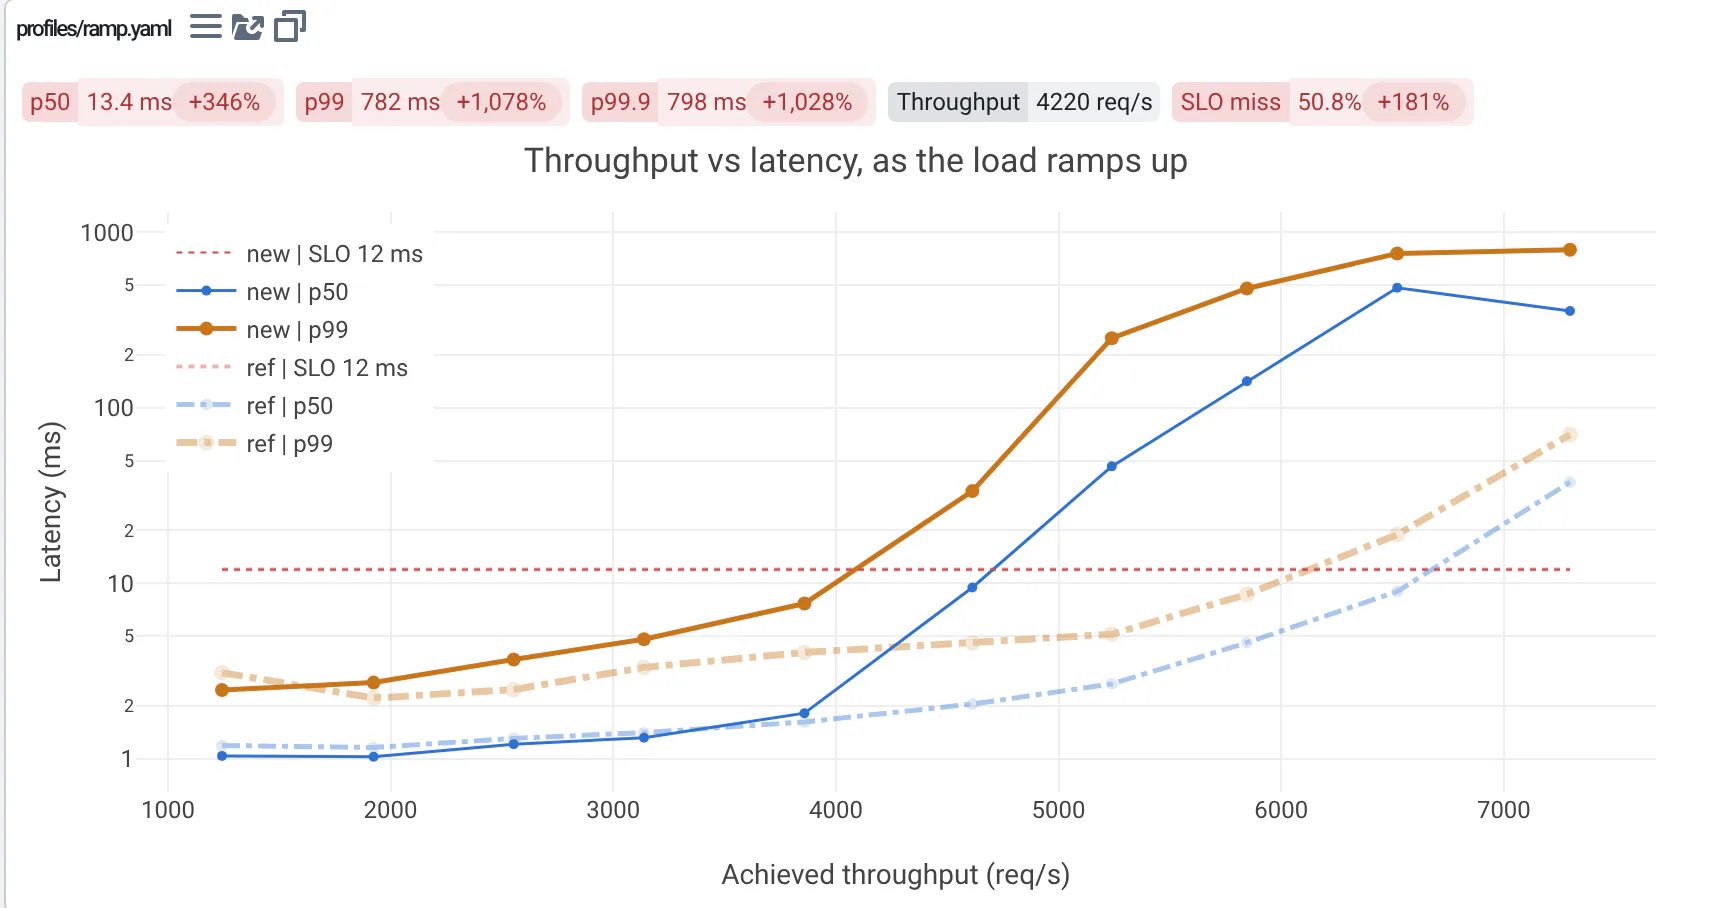
Throughput against p99, from the ramping profile: with the shared cache, p99 takes off at a lower throughput.
Flame graph diff: frames that got slower are red, faster ones blue, new ones orange. Rendering responses under the cache's lock is new.
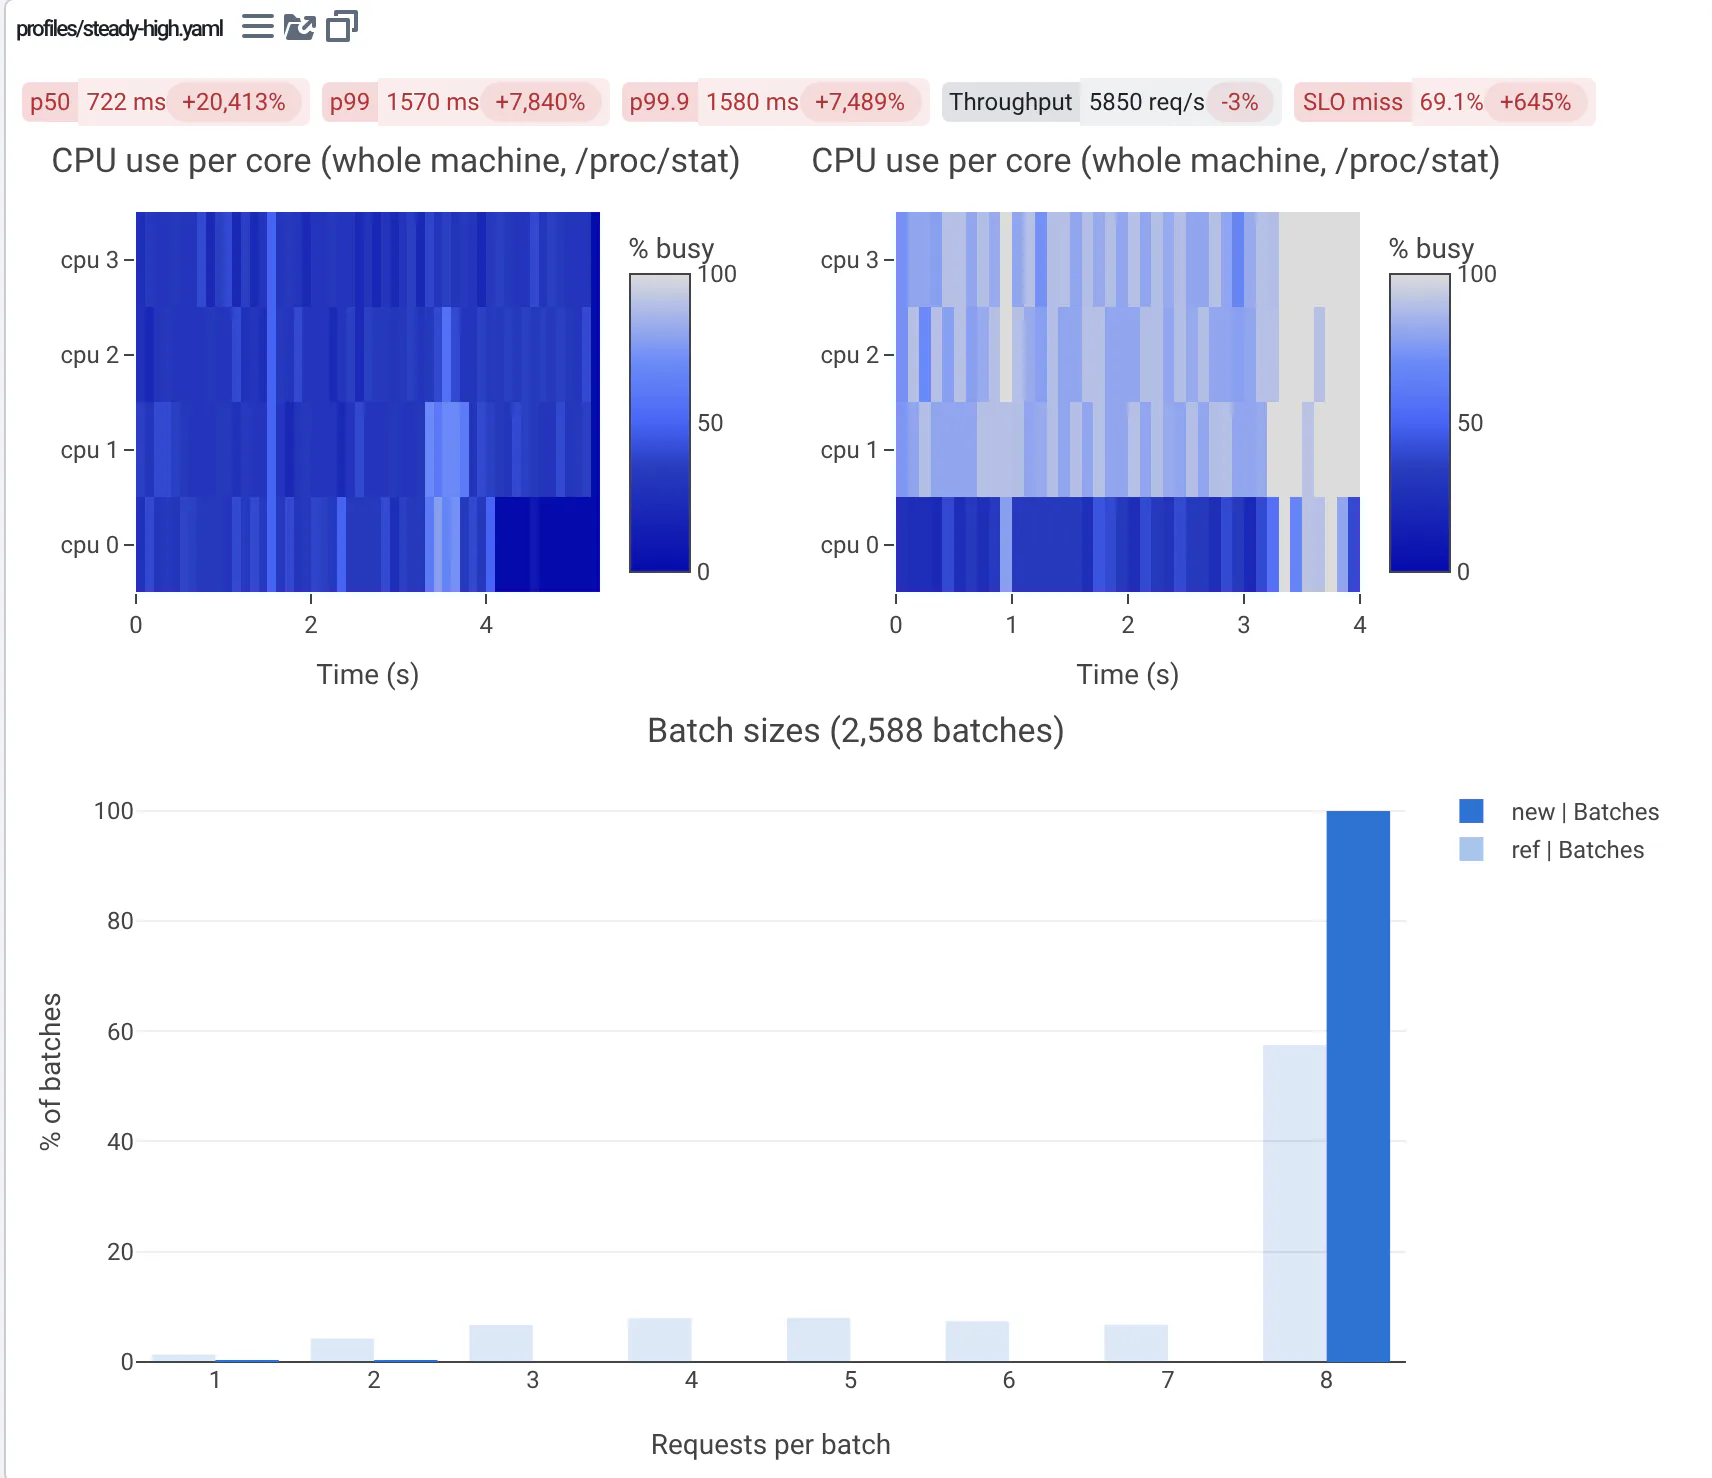
CPU per core over time, side by side, and the batch sizes.
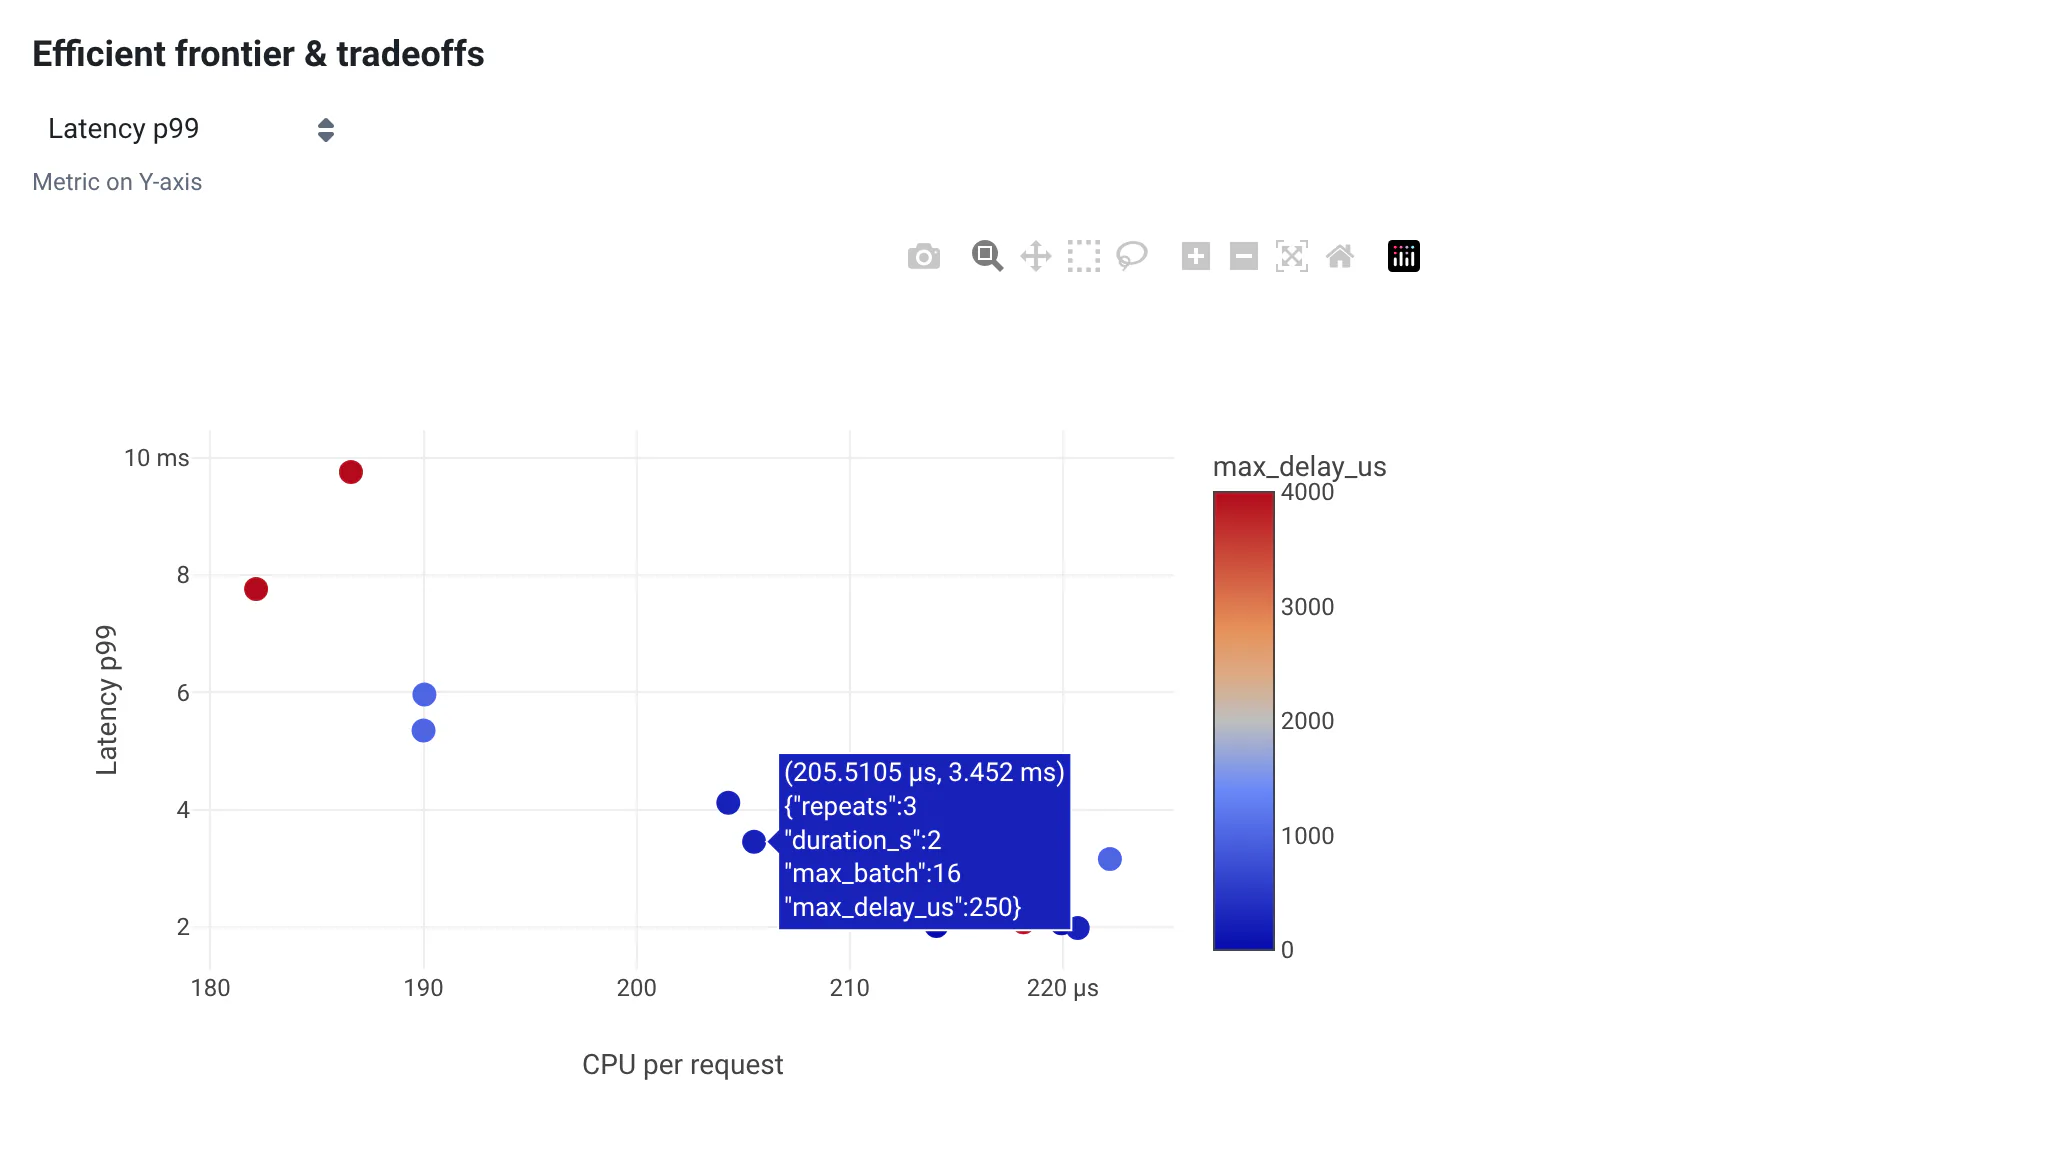
The tuning sweep's frontier of CPU per request against p99, with the chosen batching settings on it. (Under a fixed, open-loop load, throughput is the load itself.) With batching off, the maximum delay changes nothing: those runs land apart only by noise, which shows how far apart two configurations must be to differ.
History finds the payload copy: filtered on the heavy-tailed profile, the p99 line jumps at that commit, and hovering along it shows each commit's results next to the commit before.
The quality gate (experimental) fails CI on the agent's commit: p99 is over its limit.
See Quality gate to set rules on your own metrics.
The configuration
Plots set their traces' colors, so the web app draws the reference dashed and faded when side_by_side: false overlays
them. The gate's rules are on p99 and throughput.
outputs:
  metrics: qa/metrics.yaml
  visualizations:
    - name: Latency percentiles (log tail)
      path: latency_cdf.plotly.json      # x: 1/(1-p) on a log axis, labeled 50% 90% 99% 99.9%; y: ms, log
      side_by_side: false                # overlaid: the reference is dashed and faded
    - name: Where the time goes
      path: breakdown.plotly.json        # stacked bars at p50/p90/p99/p99.9: queue, batch wait, lock wait, compute
    - name: Latency over time
      path: timeline.plotly.json         # p50, p99 and max per 100 ms, queue depth on a second axis
    - name: Throughput vs p99
      path: sweep.plotly.json            # ramp runs only: achieved req/s vs p99, one point per step
      side_by_side: false
    - name: CPU flame graph
      path: cpu.flame.json               # µs of CPU per 1,000 requests
    - name: CPU per core
      path: cores.plotly.json            # heatmap, cores x time, % busy
      default_hidden: true
    - name: Batch sizes
      path: batch_sizes.plotly.json
      side_by_side: false
      default_hidden: true
    - name: Latency histogram
      path: latency_hist.plotly.json     # log-spaced bins
      side_by_side: false
      default_hidden: true
    - name: Percentiles
      path: percentiles.txt              # HdrHistogram's percentile distribution, for text diffs
      default_hidden: true

# Experimental: may change without notice
gate:
  reference: main
  batches: [ci]
  rules:
    - {metric: latency_p99, max_regression: 10%}
    - {metric: throughput, max_regression: 5%}
  max_failed_runs: 0
Runs execute one at a time, so they don't measure each other, and each run repeats its measurement: reported percentiles are the median over repeats.
Run this example
You need Rust (stable) and a Linux machine with 4 CPUs or more. The first run builds the gateway and sizes its model to your machine, so the load levels mean the same thing everywhere.
cd examples/serving-latency
qa run --input profiles/steady-high.yaml   # 6,000 requests/s, about 10 s
qa batch ci                                # 5 load profiles, about 45 s
Close what you can while it runs: a busy laptop makes for a slow gateway and noisy tails. See the example's README for the other batches.
Read more
- Visualizations: Plotly figures and flame graphs.
- History: metrics across commits.
- Tuning from the web app.