Detection: evaluating a model
For computer vision and ML engineers who ship models to devices, where quantization, input size and model size trade off against accuracy. This page follows the detector example.
The example project is examples/detection-eval.
Its screenshots show as placeholders until they're captured.
The problem
One mAP number hides where a model got worse. Quantizing a detector to int8 makes it several times smaller, and the average moves less than what you lost on one kind of scene, or on the objects far away. You need metrics per class and per object size, on slices of your data, next to the reference model's, and the images where it went wrong.
The example
An off-the-shelf detector (torchvision's SSDlite, BSD-licensed) runs on CPU with ONNX Runtime, in fp32 and in int8, at several input sizes. It's evaluated on four slices of images: indoor, outdoor, warehouse, and small objects (people and cars pasted far away on empty scenes). Each run measures COCO-style AP, AP per object size and per class, recall on small objects, model size and latency.
The photos are public domain, and no detection dataset is: their labels come from a much larger model (Faster R-CNN), not from people. The detector is scored against what a better model sees.
The int8 model is scored with its reference arithmetic: quantization in float, as its graph says, rather than with ONNX Runtime's int8 kernels, which round differently from one CPU to another. Its metrics don't move from one CI runner to the next, which is what a regression test needs.
Its story:
- The first int8 model is 3.5 times smaller, which is what the robot's accelerator needs. It loses 35% of its mAP on the indoor slice, and some of the small objects.
- Per-channel weights and percentile calibration bring the indoor slice back.
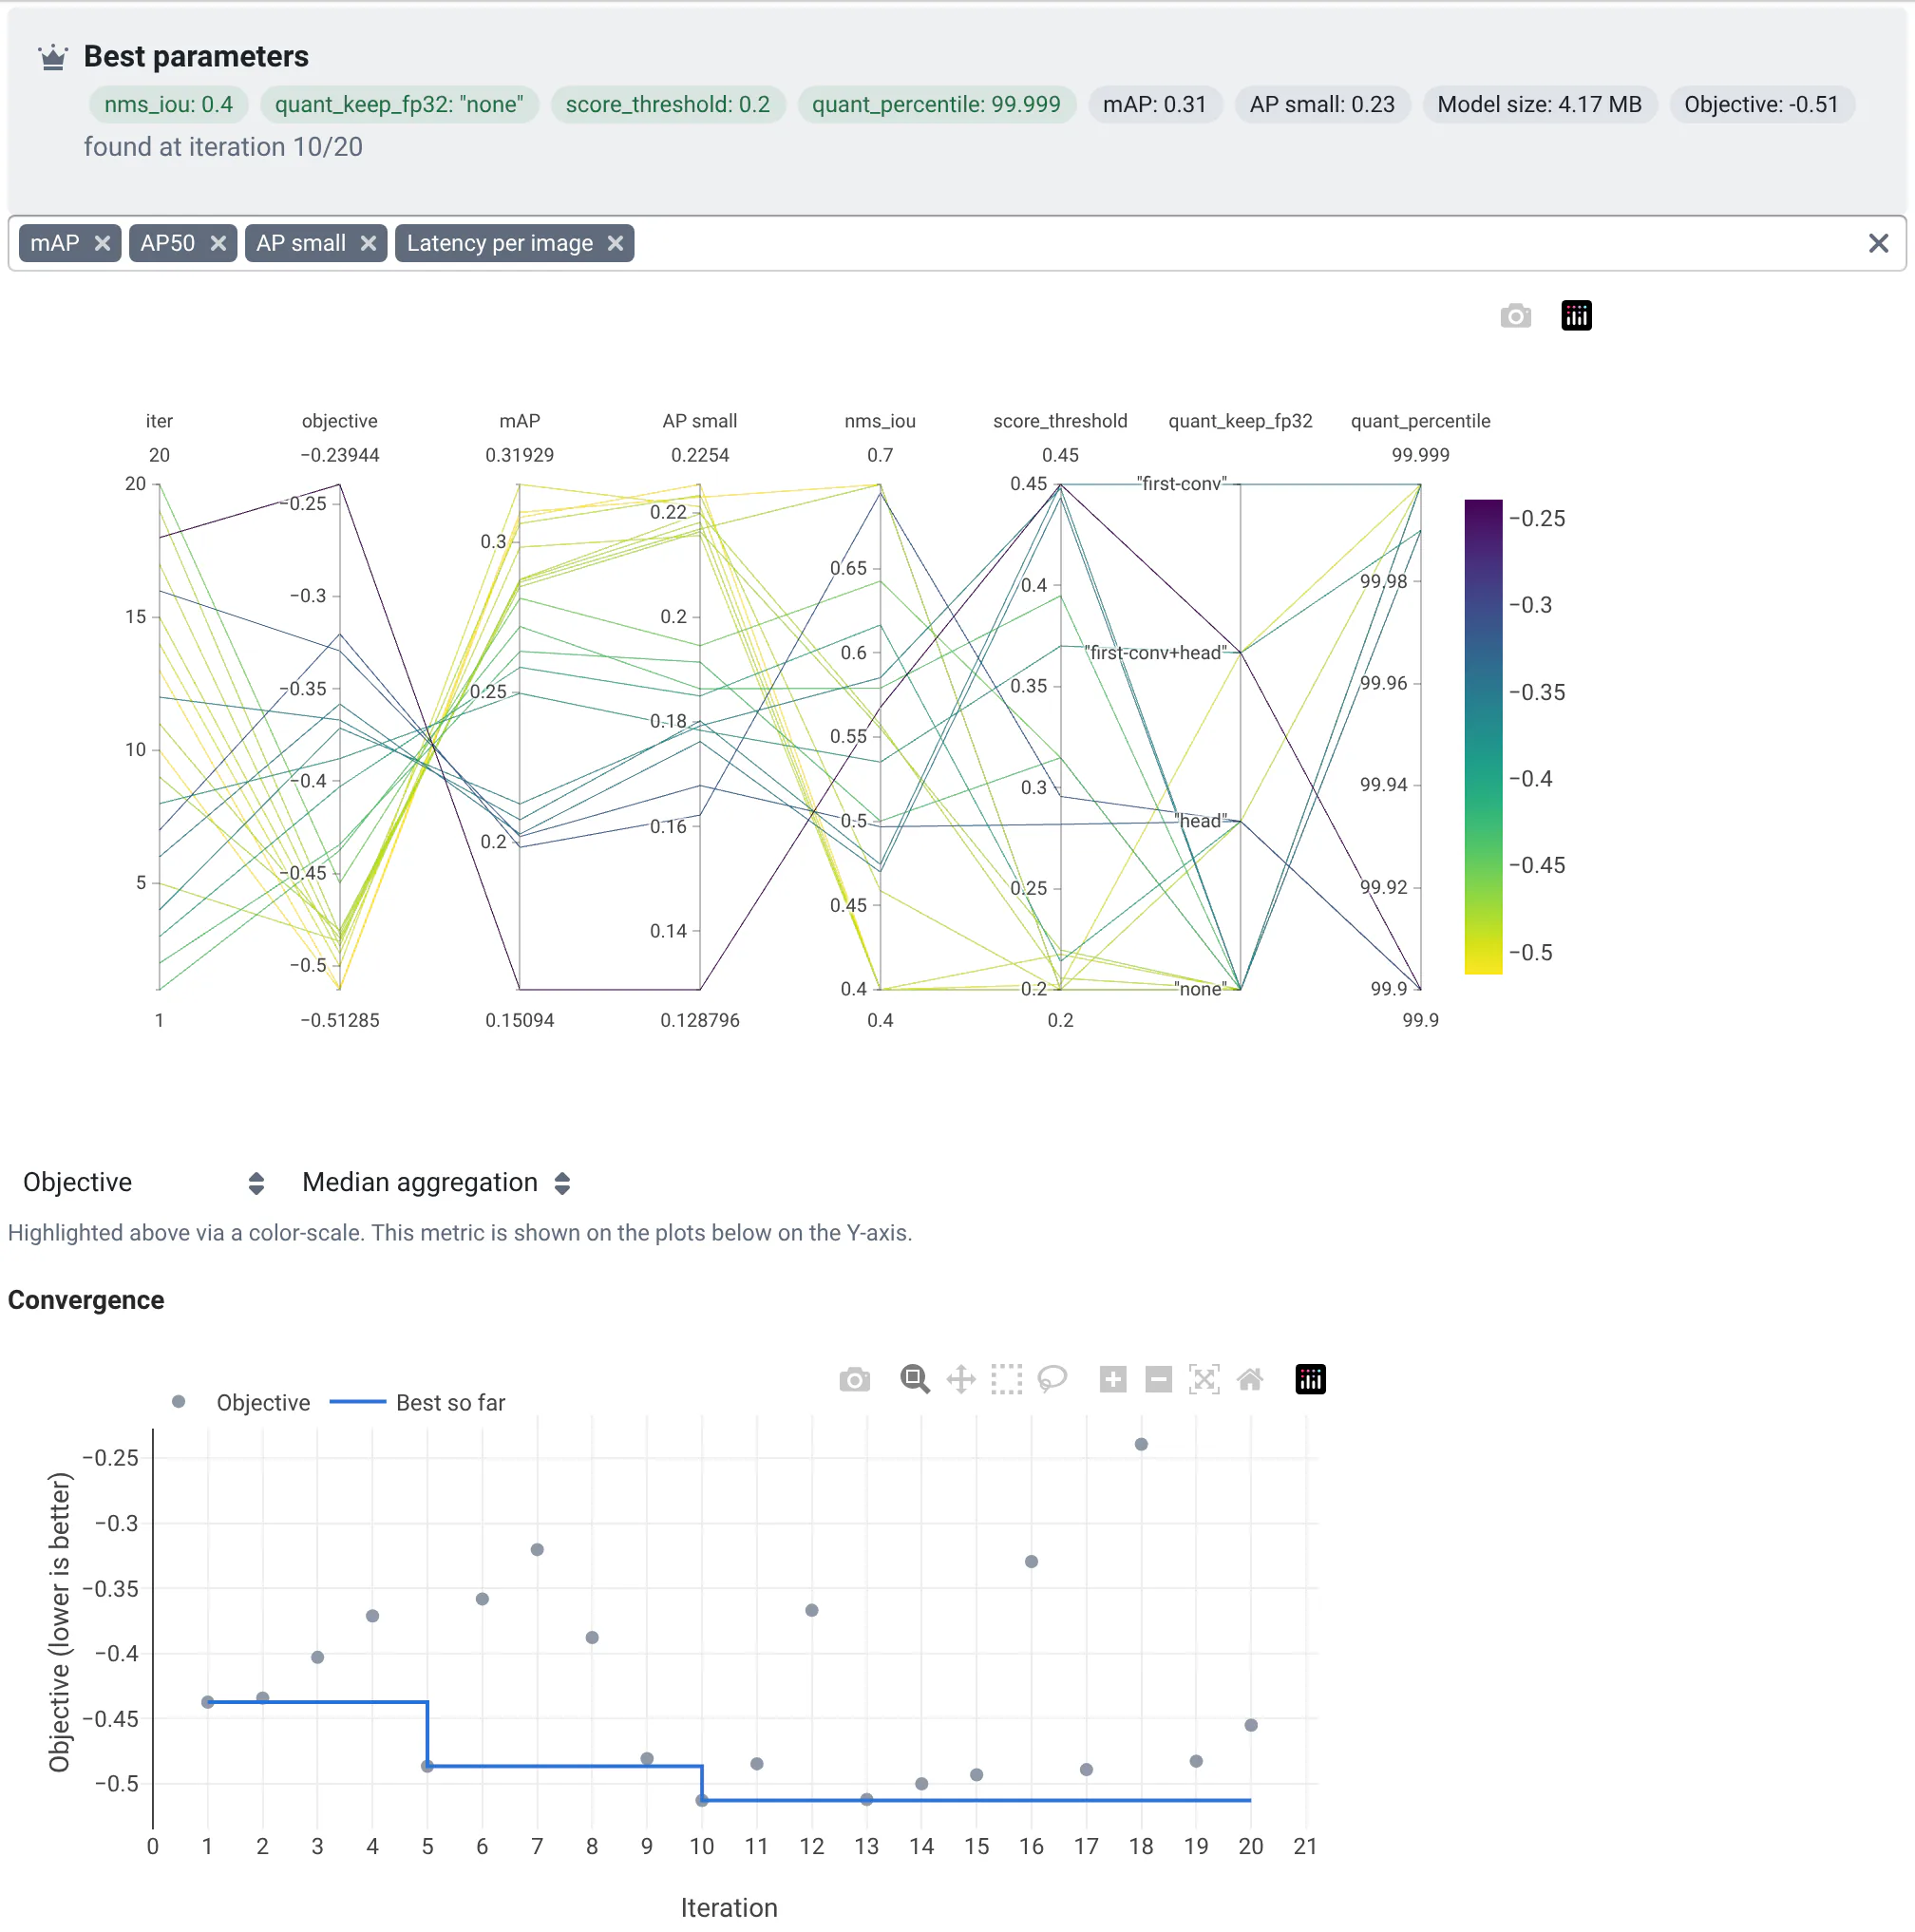
qa optimizesearches the quantization and post-processing settings; the Analysis view shows which ones matter. With them, the int8 model finds small objects as well as the last fp32 release.- The tuned model ships as a milestone, the next reference.
What you see
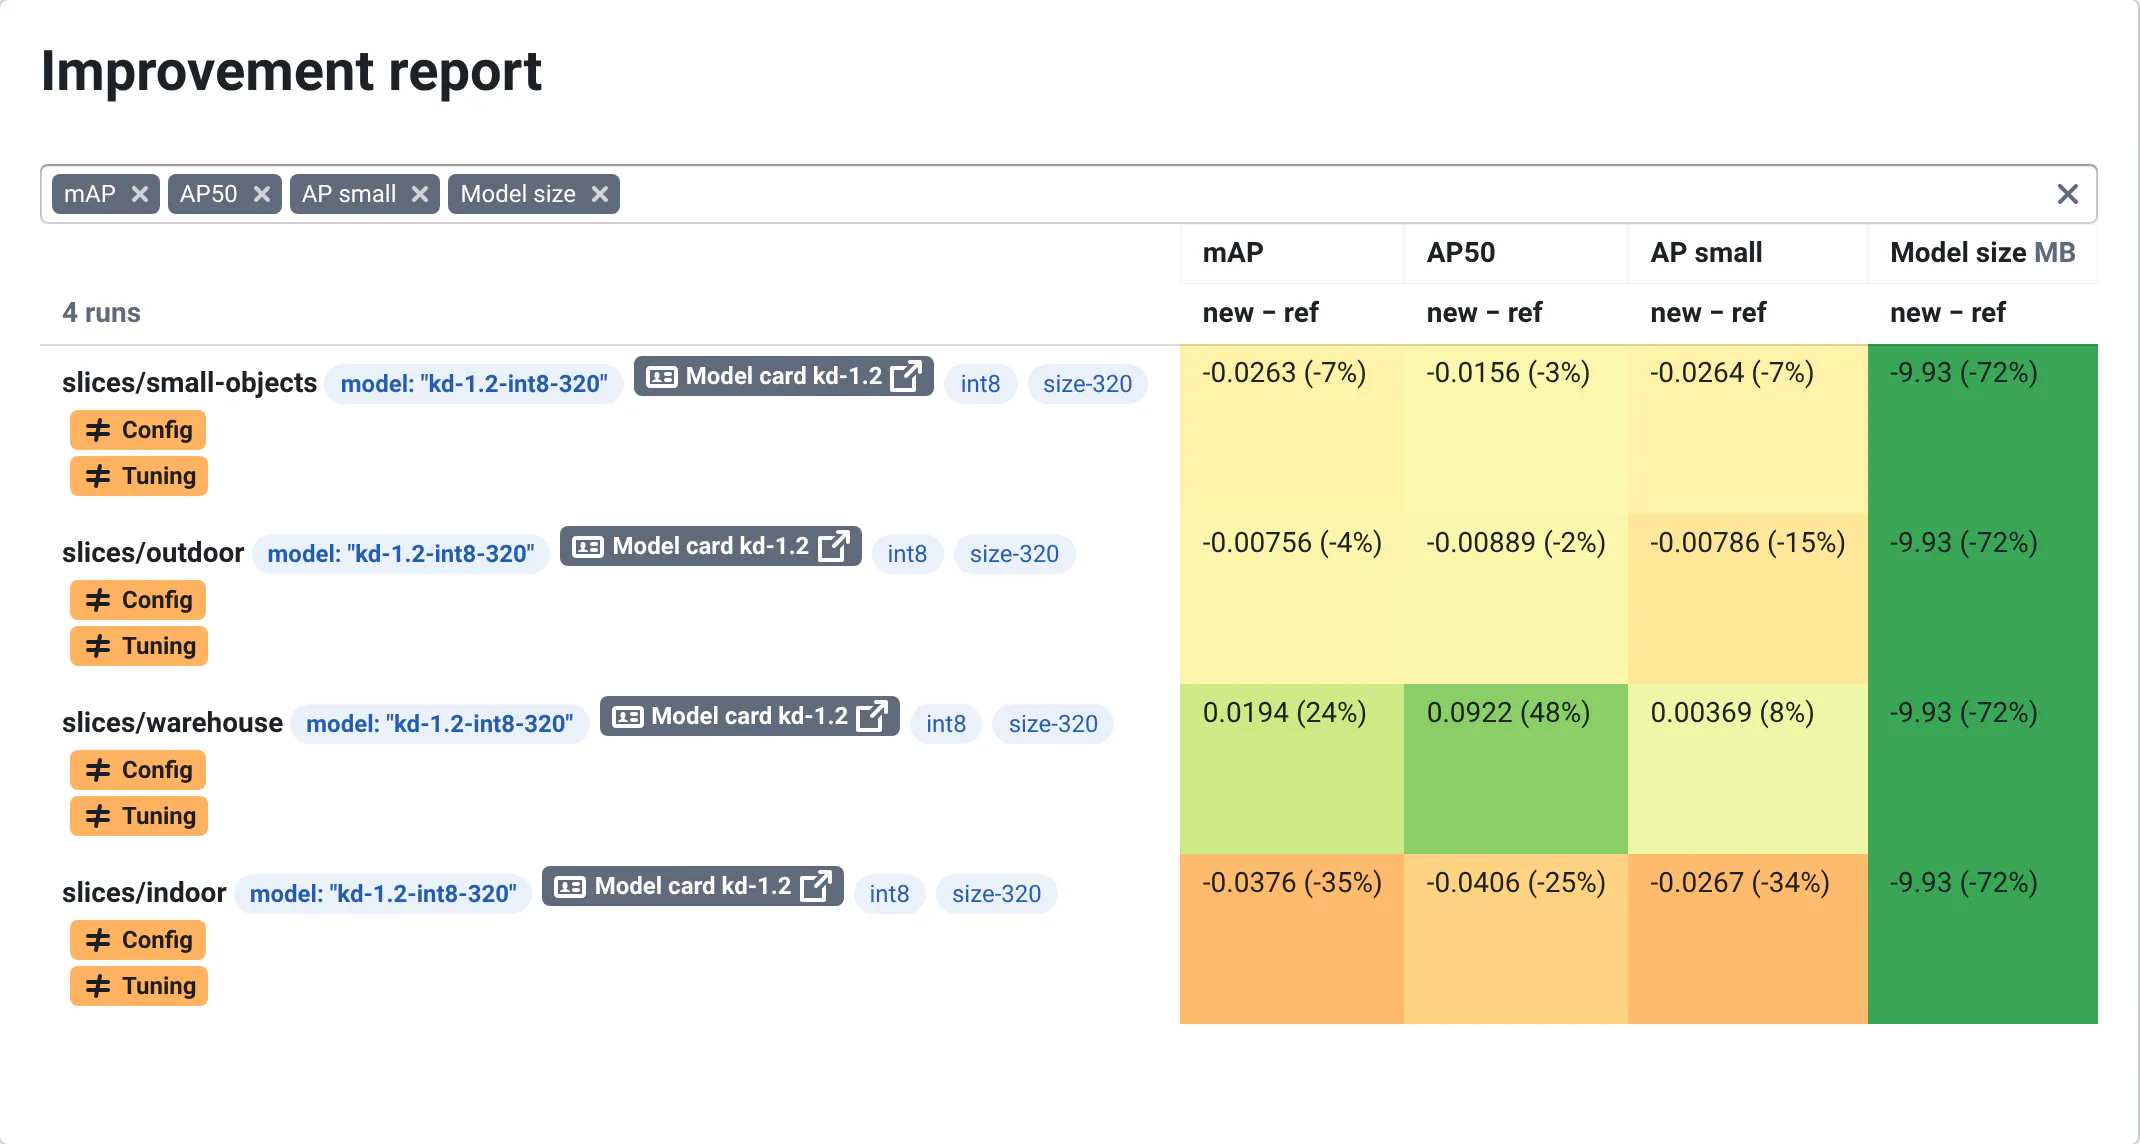
Metrics Diff per slice: int8 against fp32, the model 72% smaller everywhere, mAP and AP on small objects red on the indoor slice.
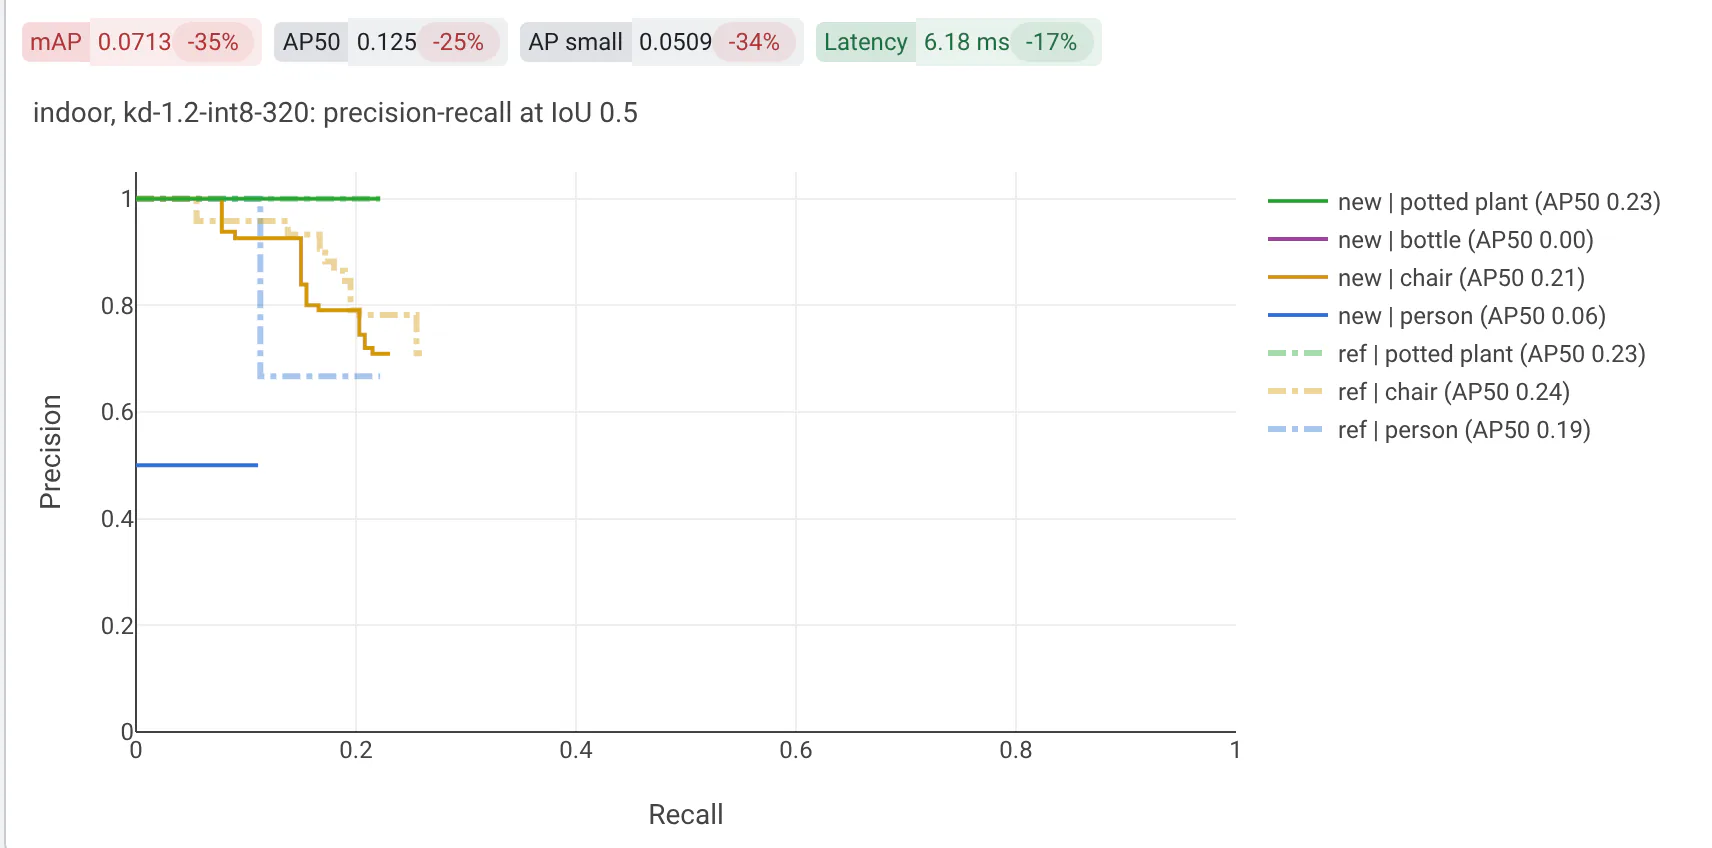
Precision-recall curves per class, int8 over the fp32 reference drawn dashed.
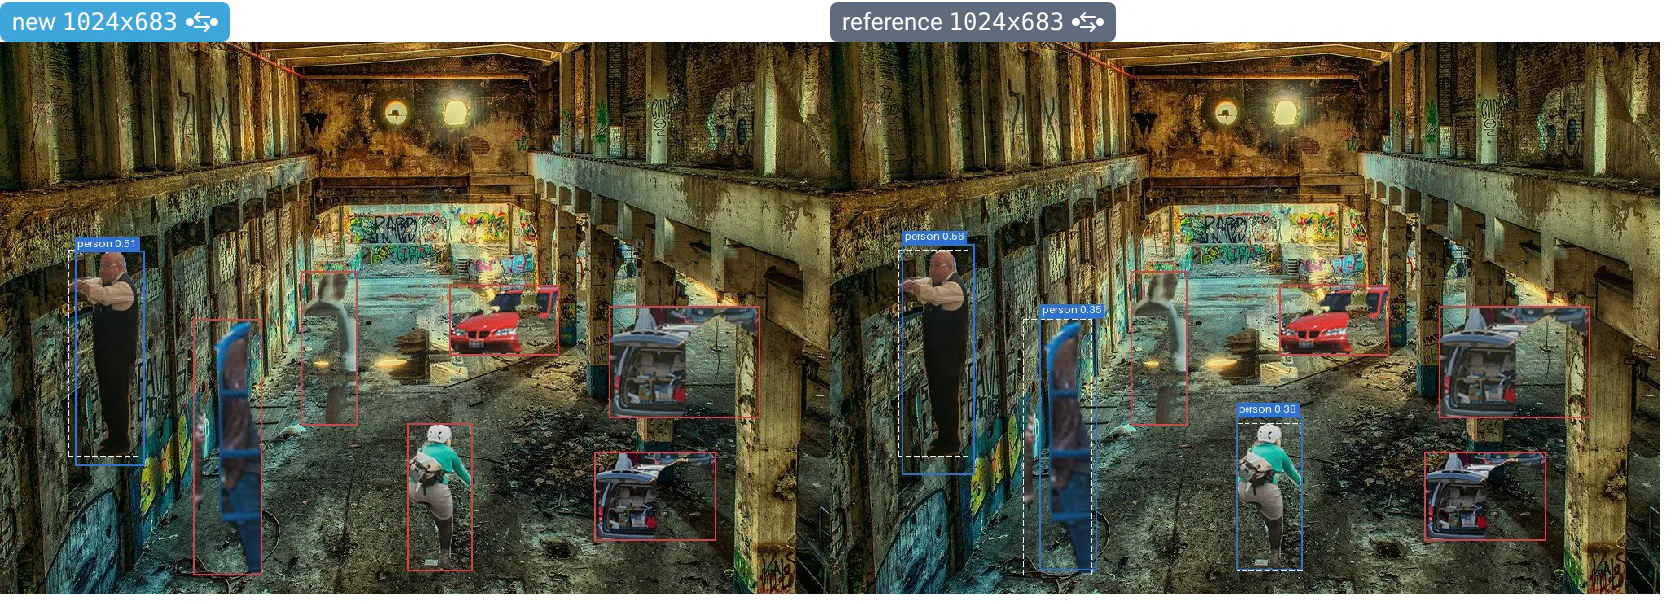
Detections on the images: the int8 model misses people that fp32 finds (in red).
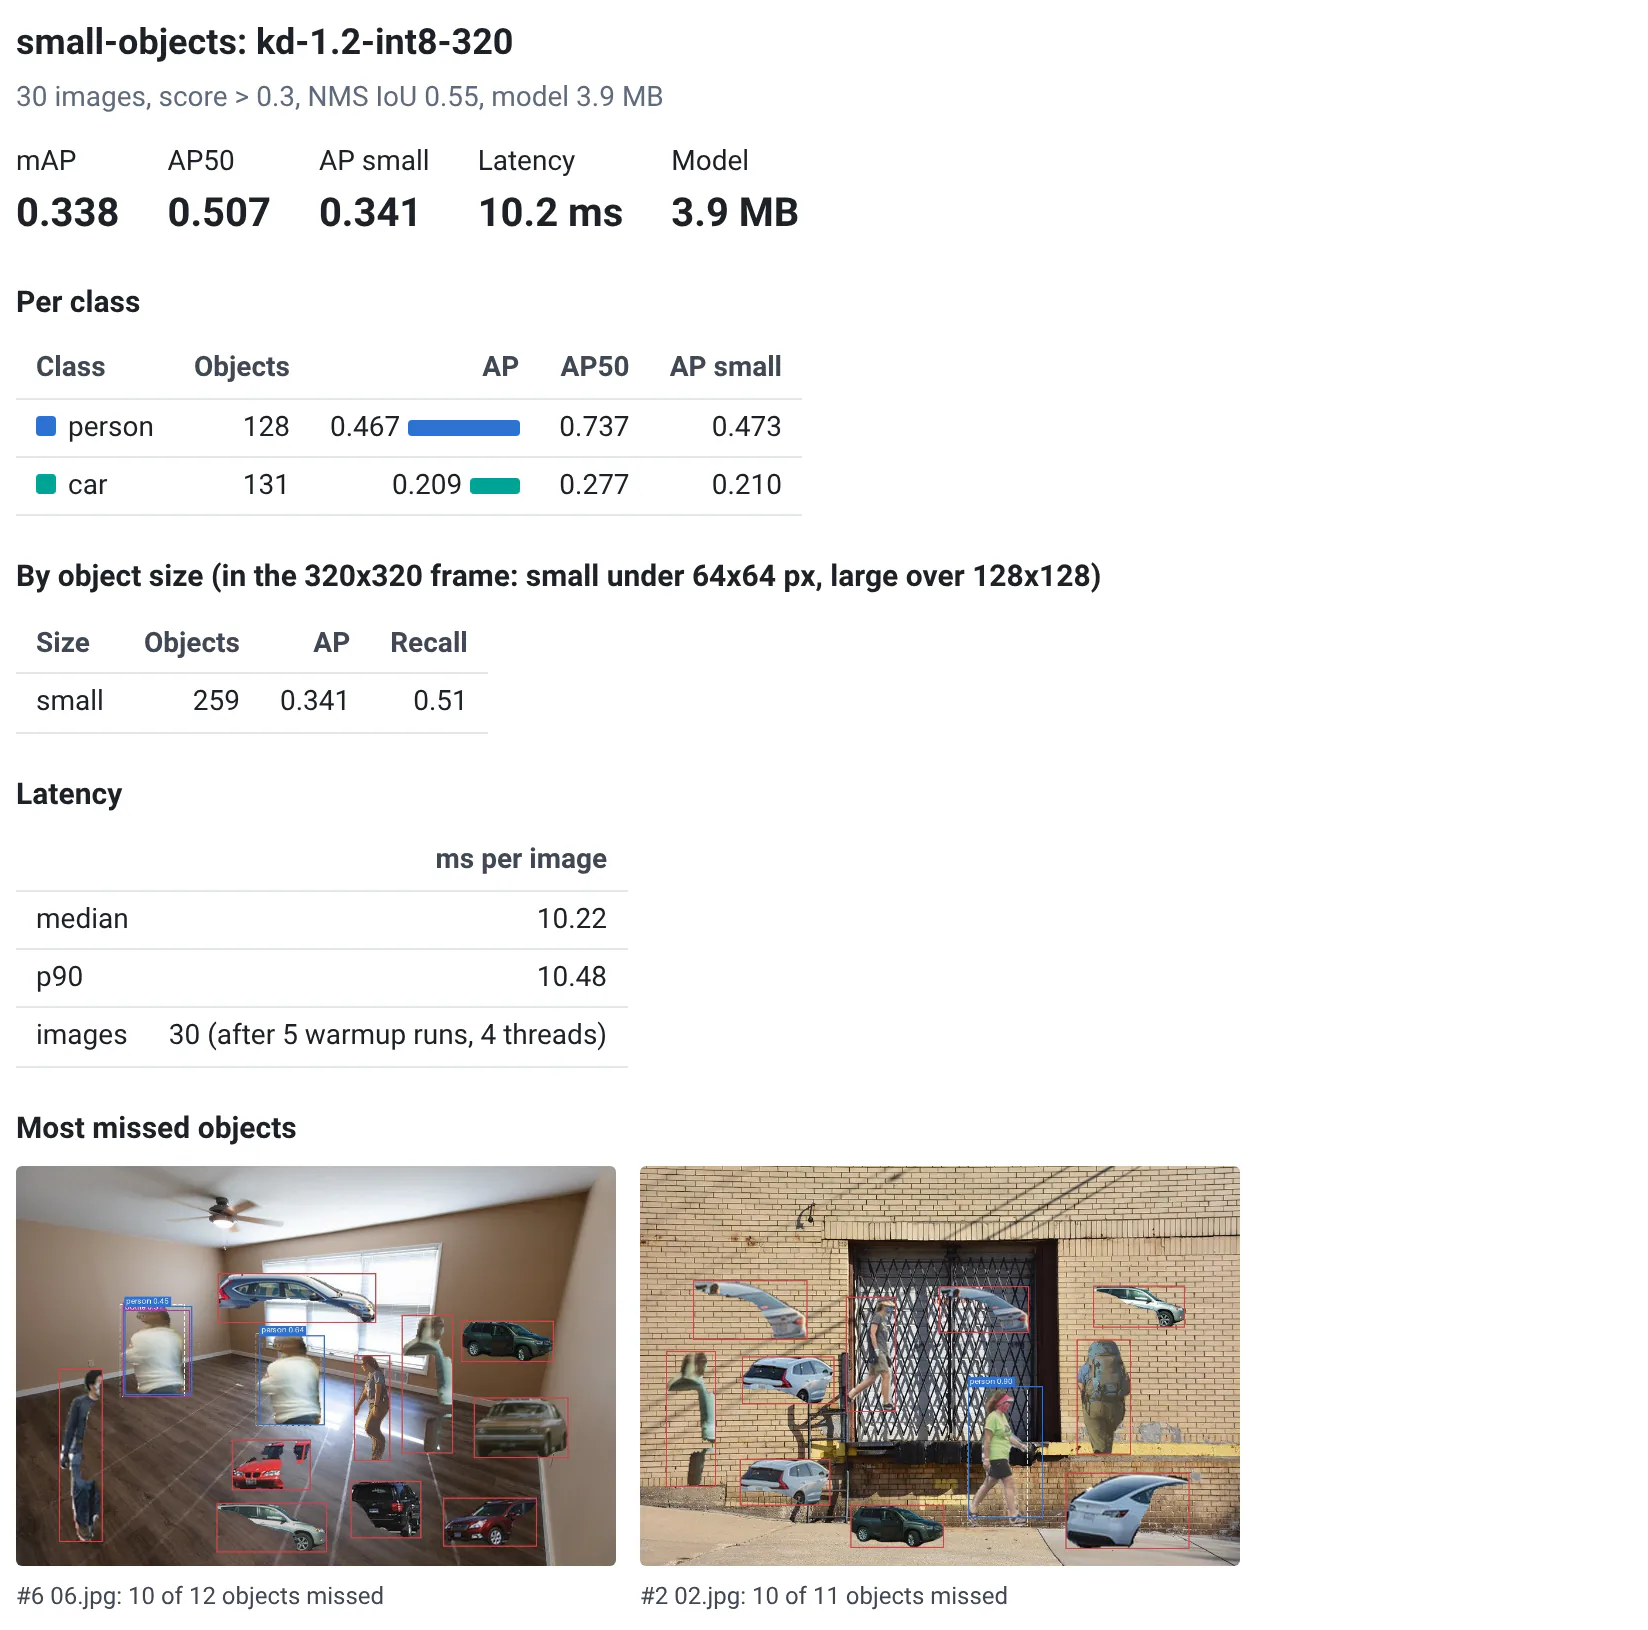
An HTML report per run, with AP per class and object size, and the images where the most objects were missed.
Automated tuning: qa optimize tries quantization settings; the Analysis view shows their convergence, each
parameter's effect, and the trade-offs.
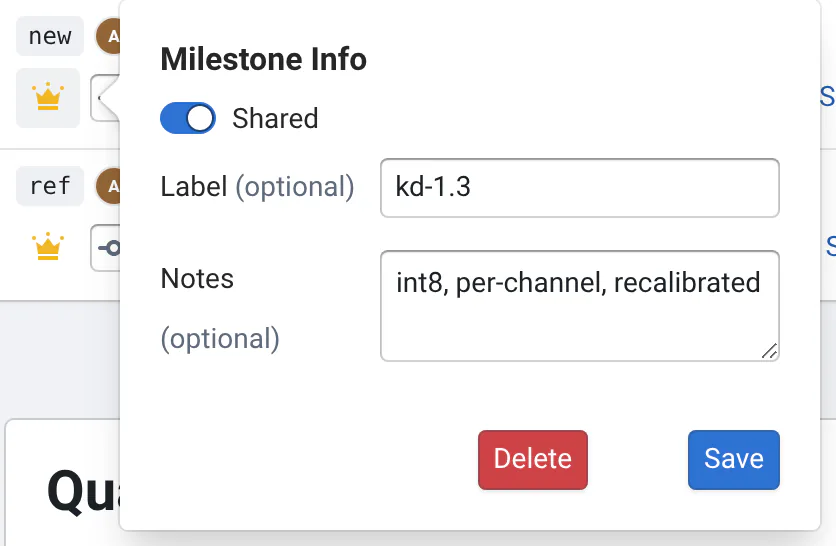
A milestone for the release: the tuned model's commit is saved with a label and notes, shared with the team, and becomes the reference the next changes are compared with.
The configuration
:image in a path gives a slider over the slice's images, synced across runs. The plots set their traces' colors, so
with side_by_side: false the web app draws the reference dashed and faded on the same axes.
inputs:
  # relative to this folder: each slice of the test set is a folder with its images and labels.json
  database:
    linux: inputs
  globs: labels.json
  use_parent_folder: true
  batches: qa/batches.yaml

outputs:
  metrics: qa/metrics.yaml
  # Run cards wide enough for the photos (new and reference about 415 px wide each) and the plots (840 px by default)
  style:
    width: 840px
  visualizations:
    - name: Detections
      path: "images/:image.jpg"          # 1..N, a synced slider over the slice's images
    - name: Precision-recall
      path: pr.plotly.json               # a curve per class at IoU 0.5: the reference's are dashed
      side_by_side: false
    - name: Recall by object size
      path: size_recall.plotly.json
      side_by_side: false
    - name: Report
      path: report.html                  # per-class AP, AP by size, latency, the images with the most missed objects
    - name: Confusions
      path: confusion.plotly.json        # labeled class x detected class, and the background
      default_hidden: true
    - name: Detections (JSON)
      path: detections.json
      default_hidden: true

# Experimental: may change without notice
gate:
  reference: main
  batches: [ci]
  rules:
    - {metric: map, min: 0.15}                       # median over the batch's runs
    - {metric: ap_small, max_regression: 10%}
    - {metric: map, per_test_max_regression: 25%}    # no slice and variant much worse than in the reference
  max_failed_runs: 0
The variants are configurations (fp32, int8, size-320...), so each run shows them as tags. To compare int8
with fp32 on the same commit, select the commit as the reference too (Also Select as Reference), then filter each
bar's runs by configuration. See Picking a reference.
Run this example
You need Python 3.10 or later and uv. The first run downloads the photos (about 20 MB) and the model's weights, and exports the model to ONNX with PyTorch for CPU, which uv installs in its cache (about 200 MB).
cd examples/detection-eval
pip install qaboard -r requirements.txt
qa --config int8 --config size-320 run --input slices/small-objects
qa batch ci                     # 4 slices, fp32 and int8: about 30 s
See the example's README for the other batches and the tuning.
Read more
- The commit page: Summary, Metrics Table and Metrics Diff.
- Visualizations: Plotly figures, HTML reports, dynamic outputs.
- Auto-optimization and milestones.