Image quality: a camera pipeline
For camera, ISP and imaging teams, and for embedded teams that hand an algorithm over to silicon. This page follows the camera ISP example: what it computes, how the team uses QA-Board, and the configuration that does it.
The problem
Image quality metrics disagree with eyes. PSNR goes up while edges get halos; noise goes down while texture turns to plastic. A team needs the metrics on every commit, and the images themselves, next to the reference's, down to the pixel, on charts and photos, in good and in low light. When the pipeline also runs on a chip, its fixed-point model must match bit for bit, commit after commit.
The example
examples/image-quality simulates the camera
of a (fictional) warehouse robot: lens blur, a Bayer sensor, noise. It then runs the image pipeline on the raw image:
demosaic, denoise, sharpen, tone map. On test charts and photos, it measures PSNR and SSIM against the ideal output,
noise in flat patches, sharpness (MTF50), halos (edge overshoot) and color errors. The hw-model platform runs the same
pipeline in fixed-point integers, like the camera chip.
Its story, six weeks of commits replayed into QA-Board:
- A new bilateral denoiser wins 1.6 dB of PSNR in low light, and halves the noise. It's merged.
- The images show halos along strong edges: the edge overshoot went from about 4% to 11%.
- A clamp on the sharpening keeps the PSNR gain and brings the overshoot back to 5%.
- On the fixed-point model, rounding changes are checked bit for bit before they reach the chip.
What you see
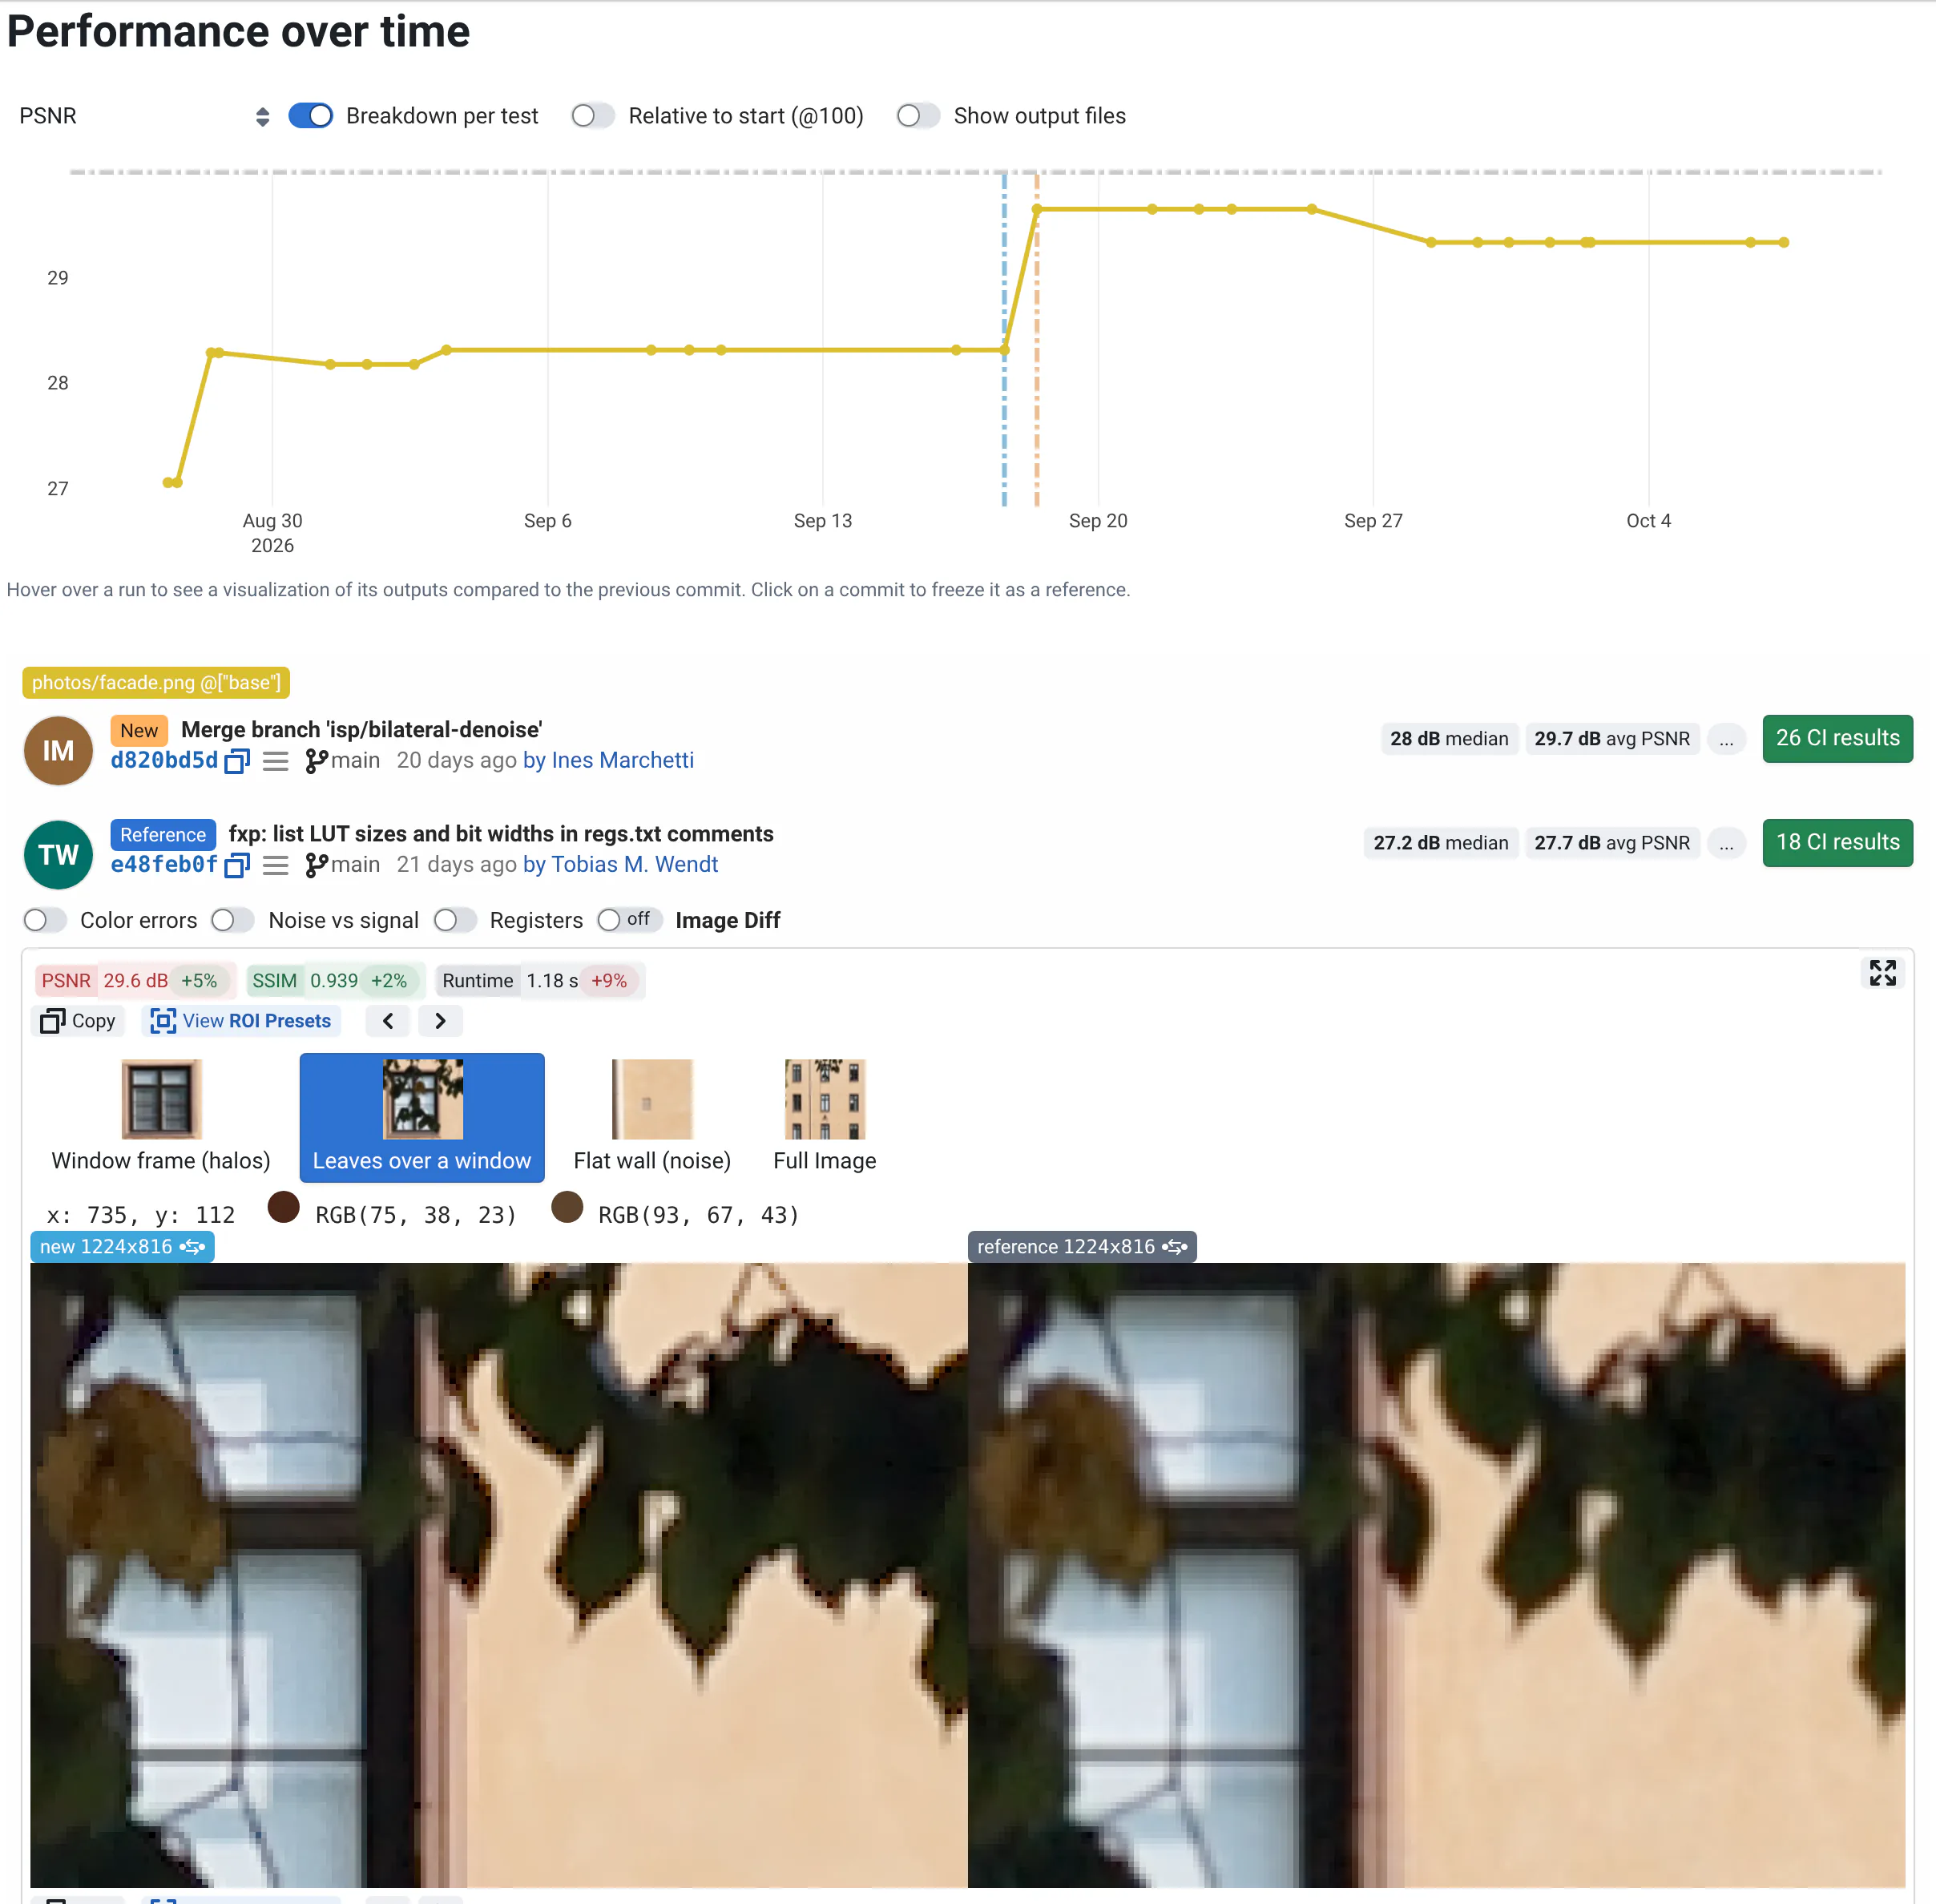
Metrics, then images. Each run's card starts with its metrics against the reference: on the facade, the merged denoiser gains PSNR and SSIM. Below, its images sit next to the reference's.
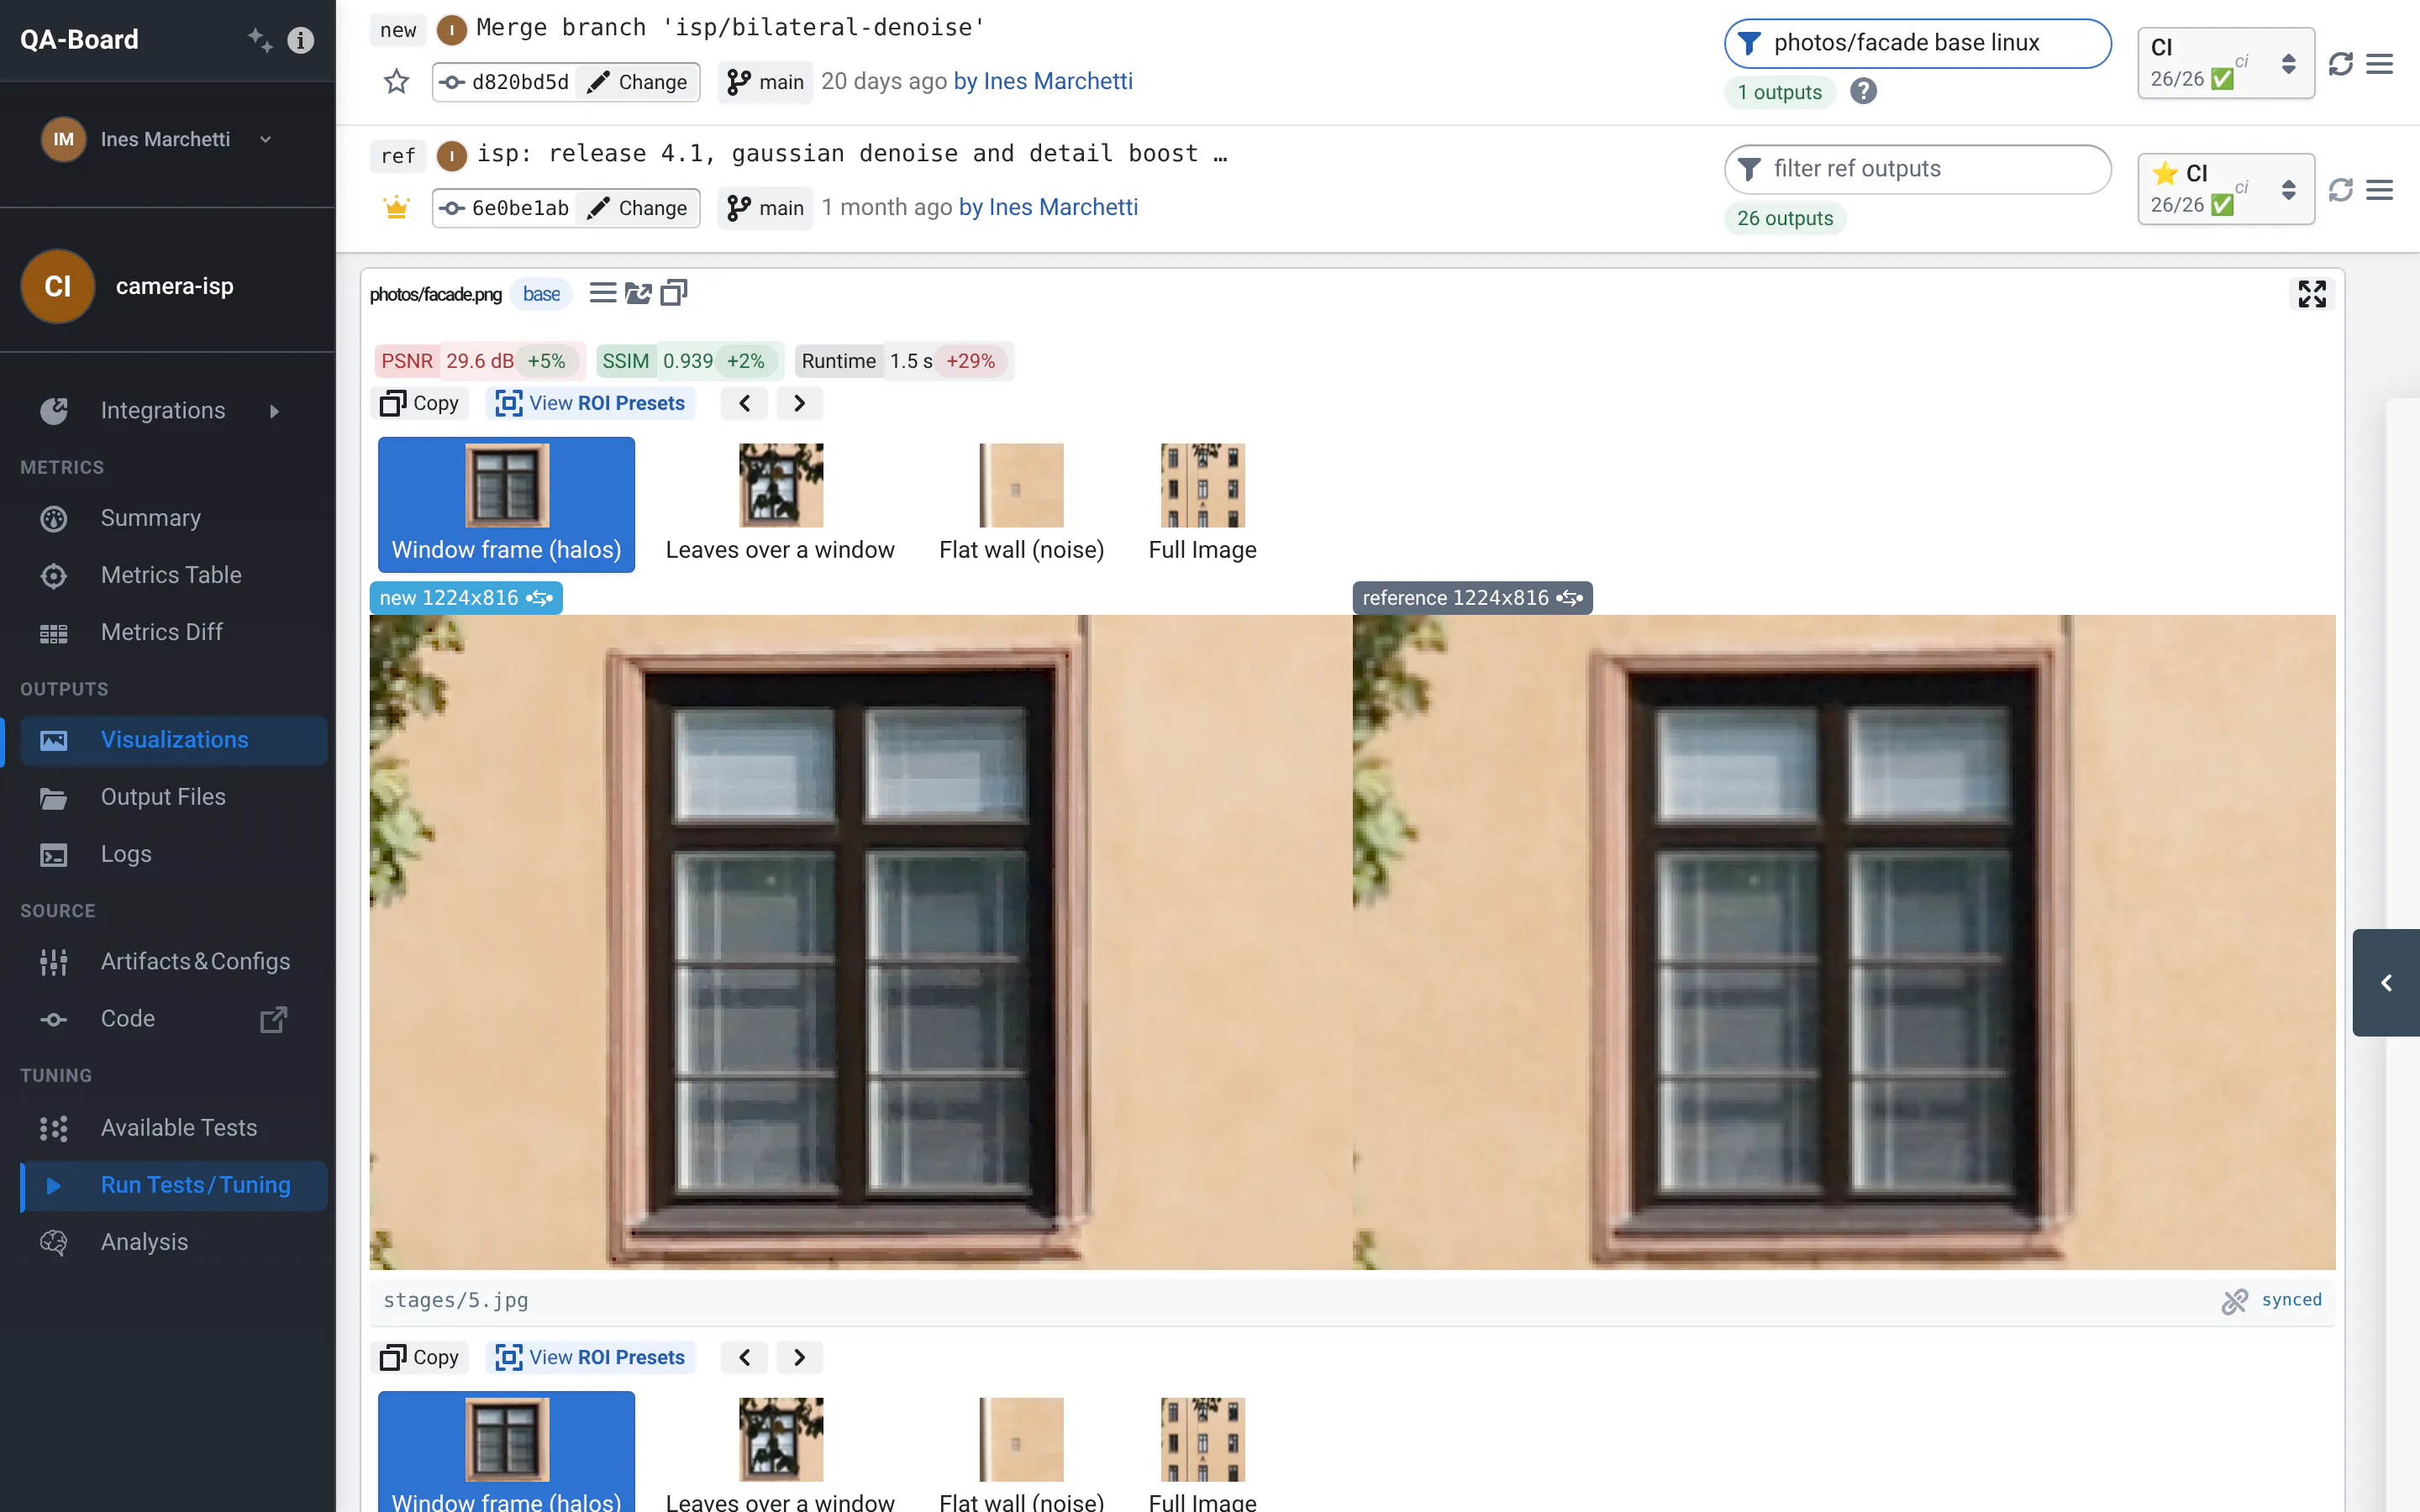
Side by side, in sync. Zoom into one image and the reference follows. The new denoiser outlines edges with dark halos.
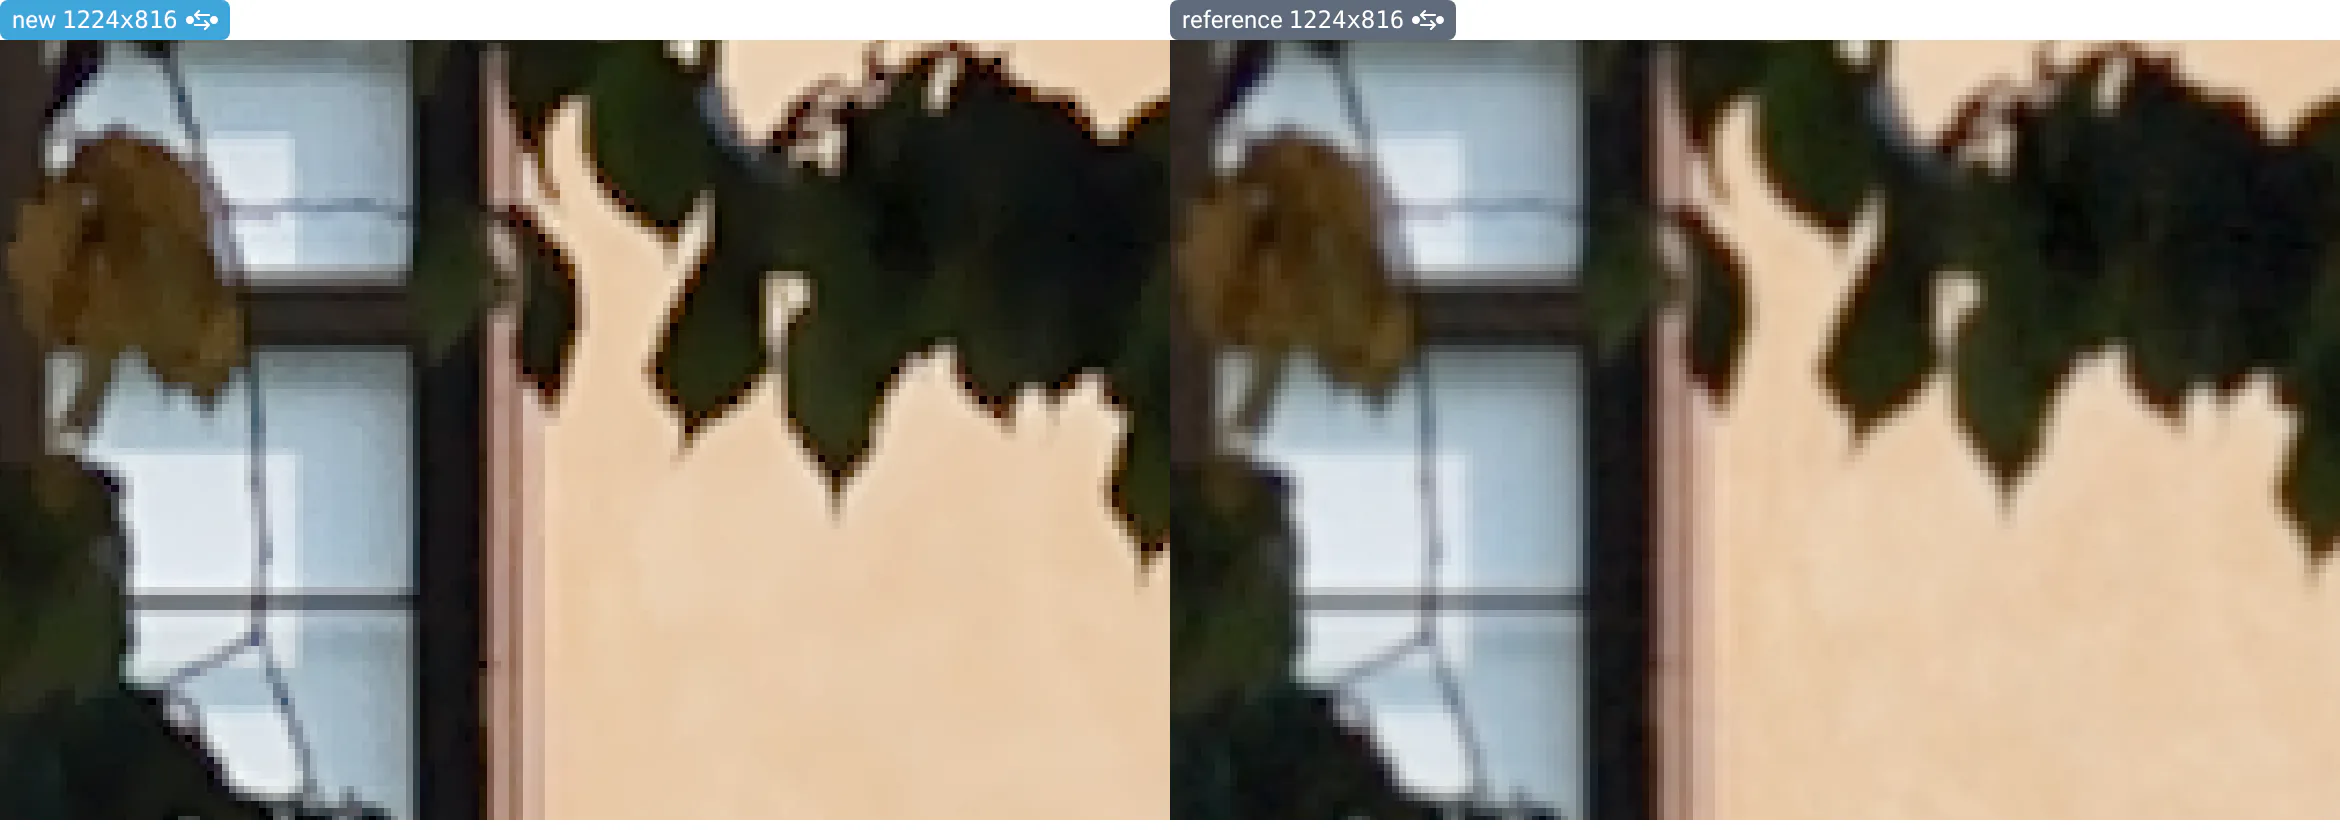
Image Diff shows where the images differ; raising its threshold leaves only the halos.
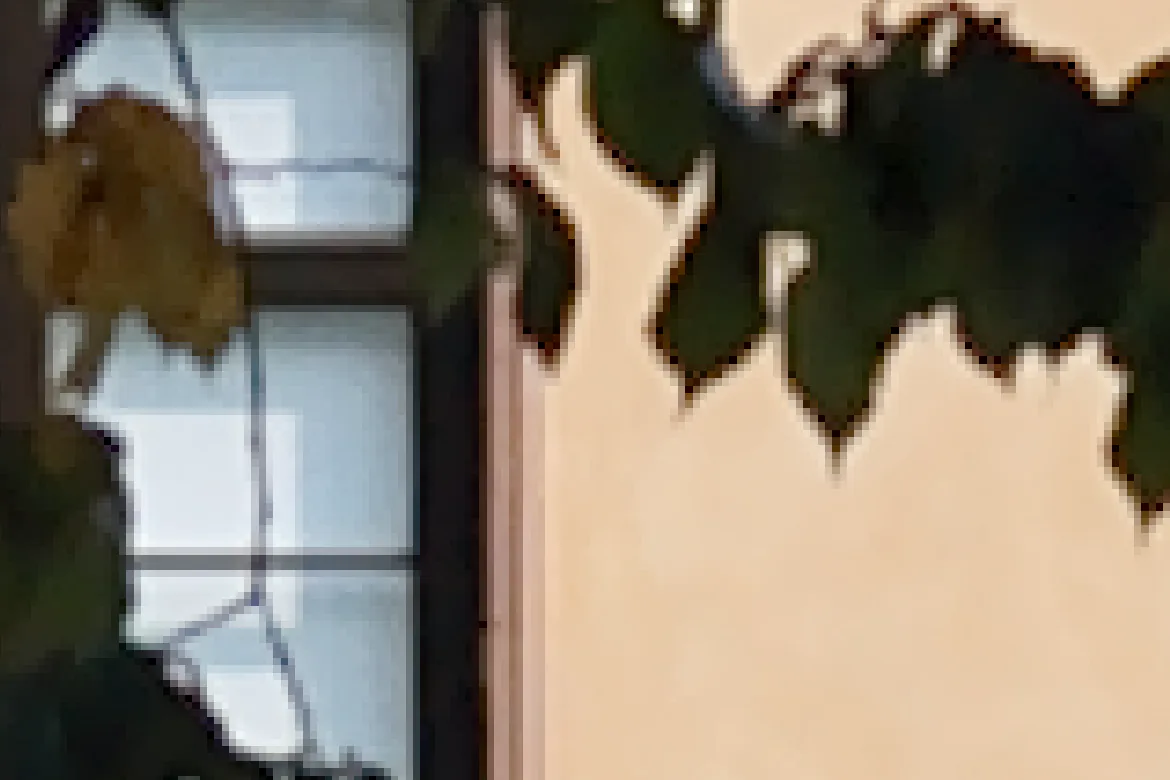
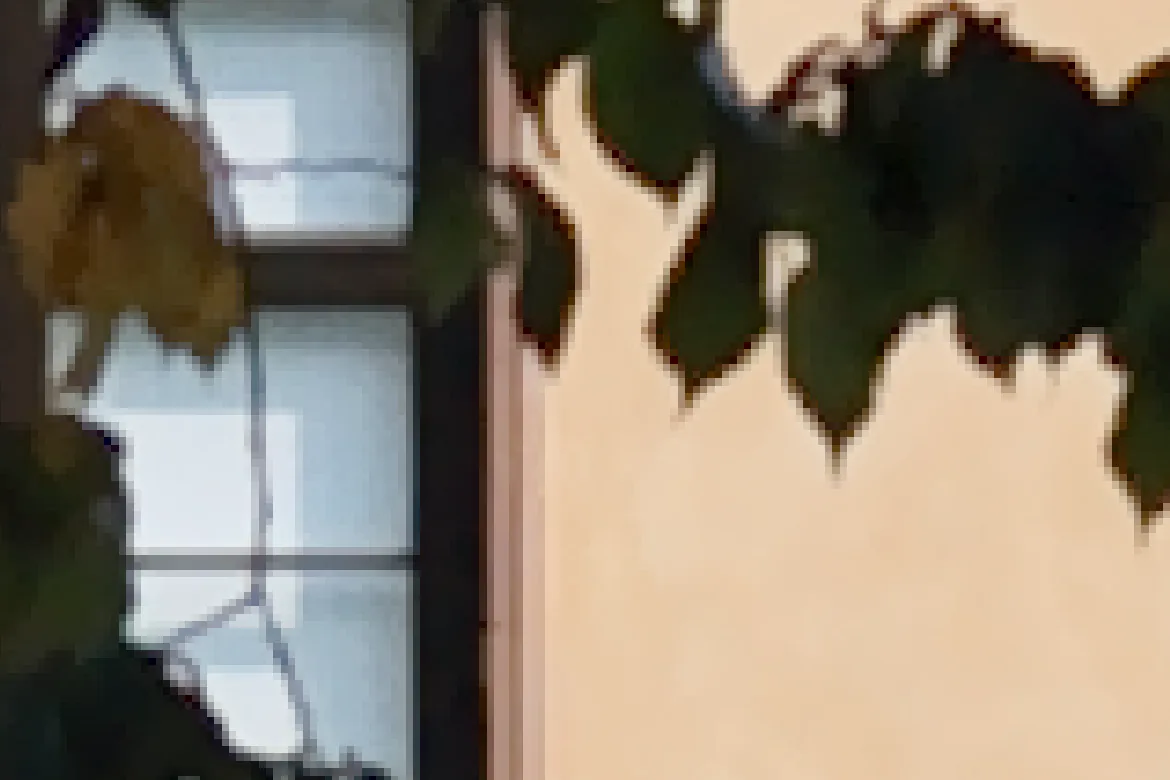
Before and after the clamp, on the same leaves: the dark rims fade, the edges stay crisp.
Deep zoom. A 113-megapixel test wall loads tile by tile, from the full view down to single pixels, in both viewers at once.
Every stage of the pipeline. A slider moves through the stages, from the raw mosaic to the tone-mapped image, in every run's card at once.
Videos, frame by frame. The camera driving down an aisle in low light, every frame through the pipeline: step through both videos in sync, wipe across them, zoom in, and see their difference. The new denoiser draws dark rims around the packages here too.
History of one input across commits: hover a point to compare its output with the commit before. The PSNR of the facade jumps when the denoiser is merged, and its leaves get halos.
Bit accuracy. On the fixed-point model, qa check-bit-accuracy fails when output files change, and lists them:
here the rounding change touches the last two stages. On a commit that only changed docs, every file is the same.
In the web app, Output Files lists the files that changed: click one to diff it with the reference. The register dump shows the rounding mode that changed. On the docs-only commit, the run is tagged Bit-accurate.
The configuration
qaboard.yaml says where the inputs are, which files to show and how, and which files must stay bit-accurate. Paths
with :stage give the synced slider over the stages.
inputs:
  # relative to this folder: generated charts, downloaded photos, and videos made from them (clips/*.yaml)
  database:
    linux: inputs
    windows: inputs
  globs: ['*.png', '*.tiff', 'clips/*.yaml']
  batches: qa/batches.yaml

outputs:
  metrics: qa/metrics.yaml
  # Run cards as wide as a laptop's screen allows: new and reference images are about 600 px wide each
  style:
    width: 1180px
  visualizations:
    - name: Output
      path: out.png                      # the 113 MP wall has out.tiff instead, streamed through IIIF
    - name: ISP stage (1 raw, 2 demosaic, 3 denoise, 4 sharpen, 5 tone map)
      path: "stages/:stage.jpg"          # 1..5: sequential integers give a synced slider
    - name: ISP stage, hw-model
      path: "stages/:stage.png"          # the 256x256 window of raw/*.u16, as PNG, to compare bit for bit
    - name: Edge profile
      path: edge.plotly.json             # slanted edge: ESF, with the overshoot annotated
      side_by_side: false
    - name: MTF
      path: mtf.plotly.json
      side_by_side: false
    - name: Color errors
      path: color.plotly.json            # ΔE2000 per patch, bars
      side_by_side: false
      default_hidden: true
    - name: Noise vs signal
      path: noise.plotly.json
      side_by_side: false
      default_hidden: true
    - name: Registers
      path: regs.txt                     # hw-model only
      default_hidden: true
    - name: Video
      path: out.webm                     # clips/*.yaml: played in sync with the reference, frame by frame
      fps: 24

bit_accuracy:
  patterns: ['out.png', 'stages/*.png', 'raw/*.u16', 'regs.txt']
  plaintext: ['*.txt']
Each metric has a label, a unit, a target, and whether smaller is better: the web app colors changes with them. The last lines pick the metrics of the Summary, and those on each run's card and in the tables.
qa/metrics.yaml
# Metrics returned by run() in qa/main.py. Chart metrics only exist on the charts that measure them.
available_metrics:
  psnr:
    label: PSNR
    description: Peak signal-to-noise ratio of the output against the ideal output (the scene, without blur or noise, through the same tone curve).
    suffix: ' dB'
    smaller_is_better: false
    target: 30
  ssim:
    label: SSIM
    description: Structural similarity of the output's luma with the ideal output's.
    smaller_is_better: false
    target: 0.9
  noise_flat:
    label: Noise in flat patches
    short_label: Noise
    description: Standard deviation of the luma (8-bit) in the flat gray chart and in the gray patches of the color chart.
    suffix: ' DN'
    smaller_is_better: true
    target: 2.0
  mtf50:
    label: MTF50
    description: Spatial frequency where the contrast drops to 50%, measured on the slanted edge (ISO 12233-style).
    suffix: ' cy/px'
    smaller_is_better: false
    target: 0.25
  overshoot:
    label: Edge overshoot (halos)
    short_label: Overshoot
    description: How far the slanted edge's profile goes past the dark and bright levels, as a share of the step.
    suffix: '%'
    scale: 100
    smaller_is_better: true
    target: 0.05
  delta_e:
    label: Color error ΔE2000
    short_label: ΔE2000
    description: Mean CIEDE2000 difference between the color chart's patches and their ideal colors.
    smaller_is_better: true
    target: 5
  fxp_psnr:
    label: Fixed-point vs float
    short_label: FxP PSNR
    description: hw-model only. PSNR of the fixed-point output against the float pipeline's output on the same raw.
    suffix: ' dB'
    smaller_is_better: false
    target: 45
  runtime:
    label: Runtime
    description: Time to simulate the camera, run the ISP and measure.
    suffix: ' s'
    smaller_is_better: true
  is_failed:
    label: Crashed
    short_label: Crashed
    description: The run crashed.
    suffix: '%'
    scale: 100
    smaller_is_better: true
    target: 0

default_metric: psnr
summary_metrics: [psnr, ssim, overshoot, mtf50, noise_flat]
main_metrics: [psnr, ssim, overshoot, mtf50, runtime]
qa/main.py runs the camera simulation and the pipeline, writes the images and plots, and returns the metrics. See
the example's README for each
file.
Run this example
With a QA-Board server (quickstart), from a clone of the repository:
cd examples/image-quality
pip install qaboard -r requirements.txt
qa run --input charts/slanted-edge.png       # one run
qa --share batch ci                          # 5 charts and 4 photos, at ISO 100 and 3200
qa --platform hw-model --share batch bitexact  # the fixed-point model
The first run downloads the photos and generates the test charts. Results go to /mnt/qaboard, or to $QA_STORAGE.
Read more
- Comparing results: every image viewer tool.
- Visualizations: the viewers, and dynamic outputs like the stage slider.
- Bit accuracy.