Starting tuning experiments from QA-Board
How to do tuning or trigger extra runs from QA-Board
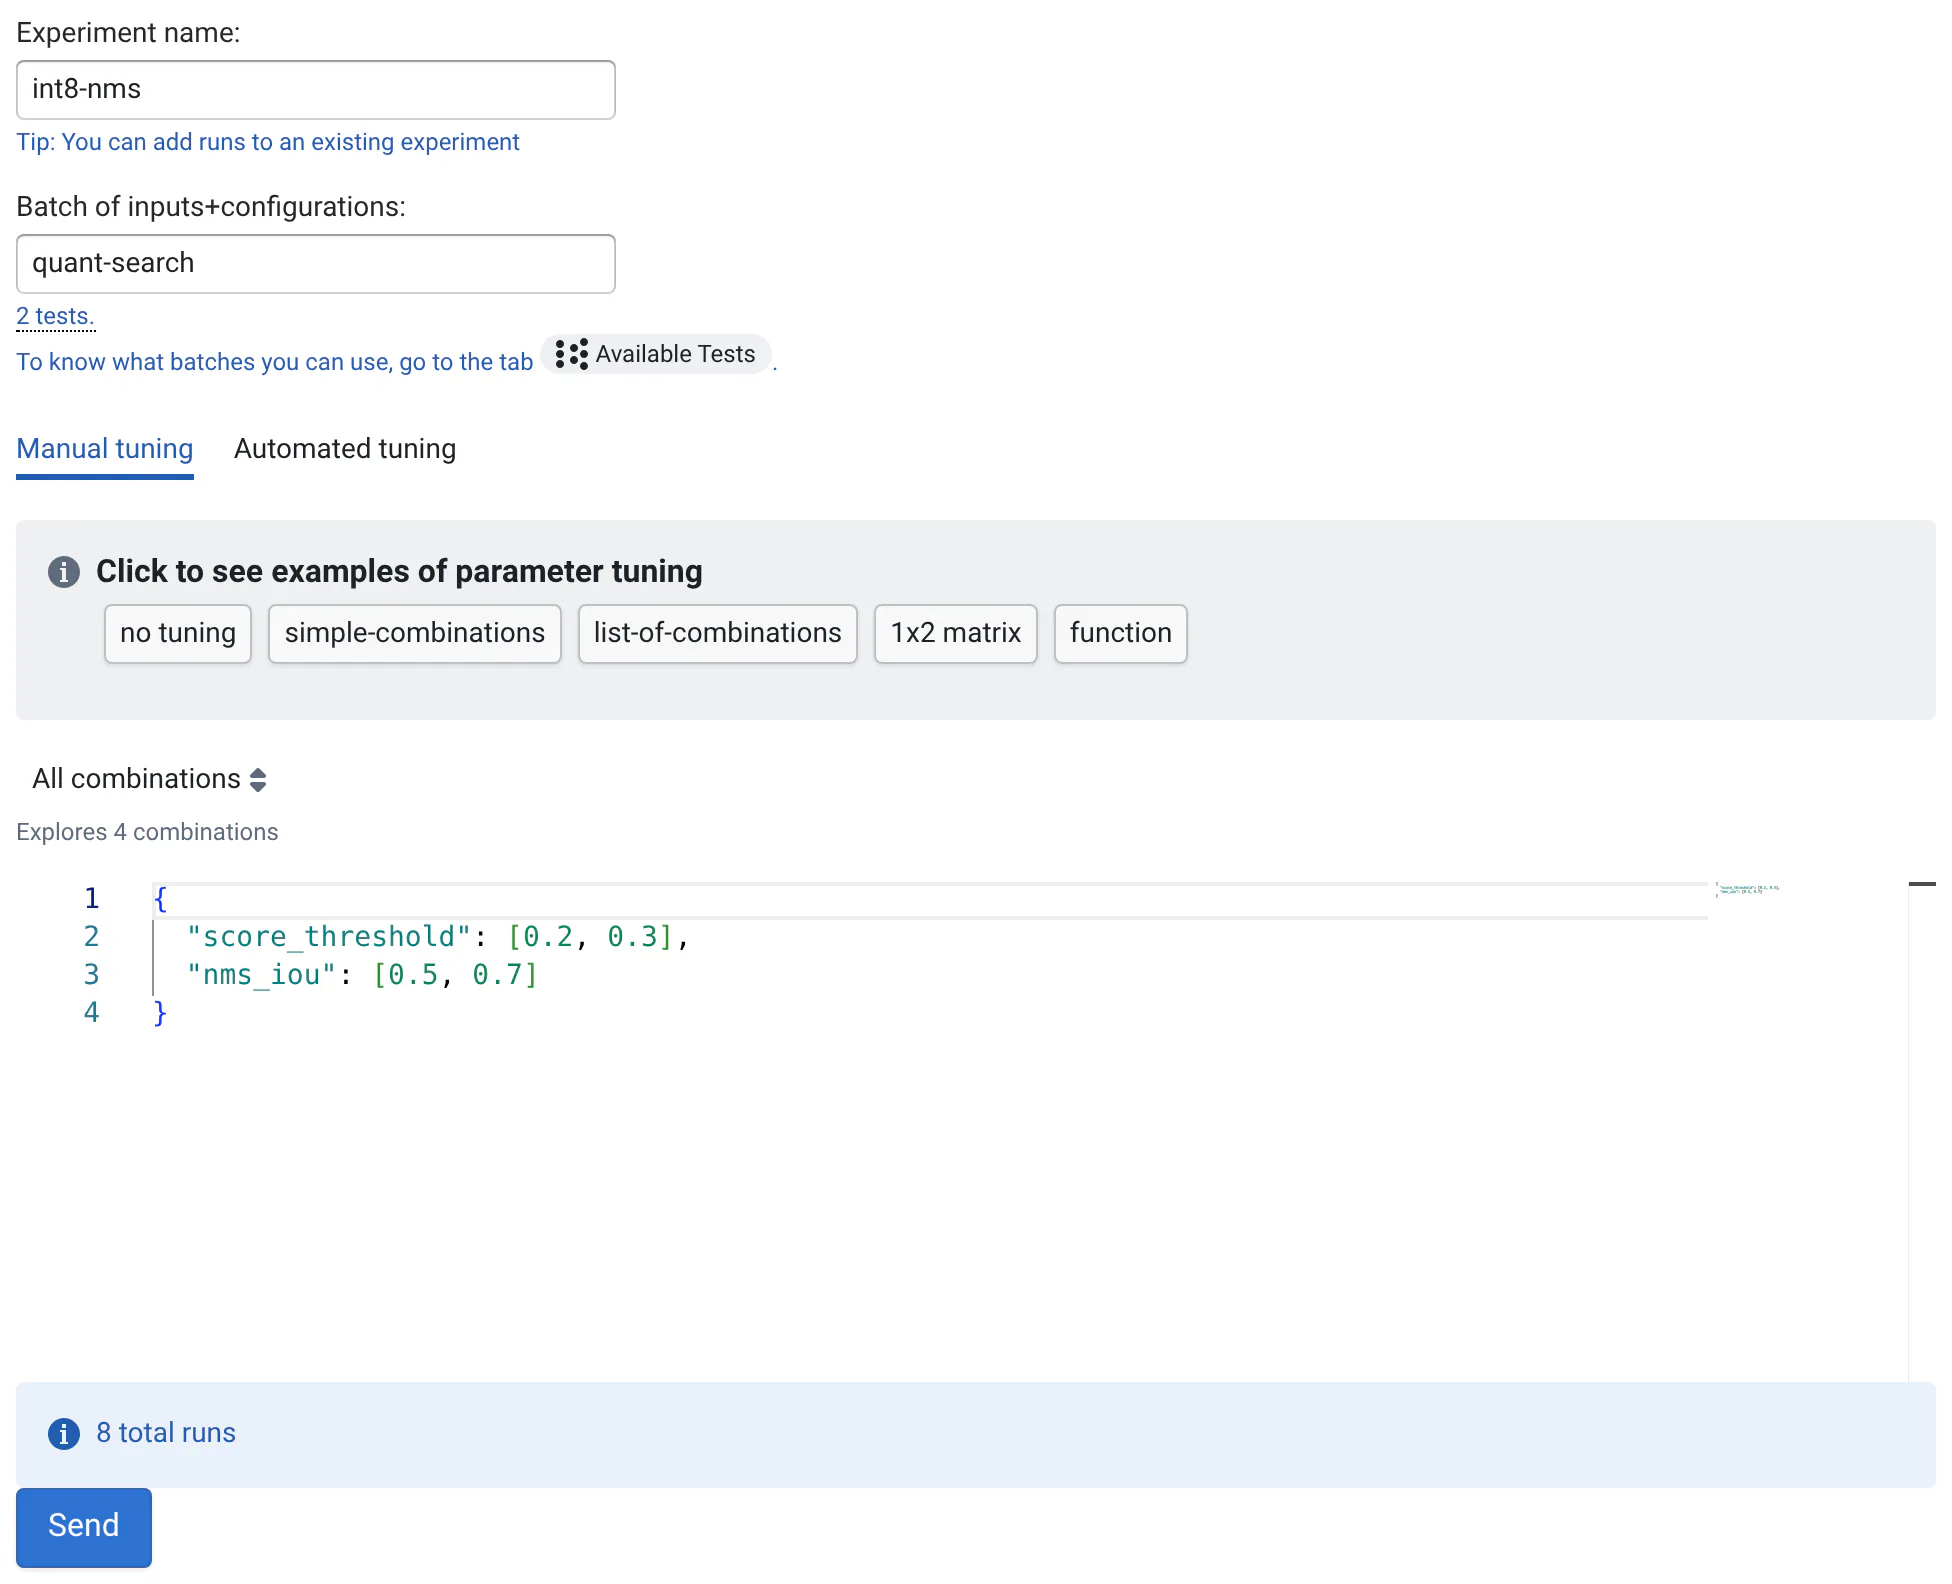
When doing QA or during development, you often want to run the code/configs from a given commit on new tests. QA-Board lets you define and runs batches of tests with extra tuning parameters:
When the batch doesn't start
QA-Board starts your batch by running qa batch (as an LSF job, with Celery, or locally on the server). If it fails or takes a while, there are no runs to look at, so the batch's page tells you what's going on:
- Waiting for LSF: the job is queued, the cluster may be busy.
- Starting your batch…:
qa batchis running. - Failed: why, e.g.
qa batch exited with code 1with the error from its logs (ModuleNotFoundError: ...), or why LSF killed it (out of memory...). - Didn't start any run: e.g. there were no inputs, or all the runs already existed.
In the Logs view, Started from QA-Board lists the last batches you started, each with the qa batch command, its logs and LSF's report. They are saved in the batch directory, under qaboard-batches/.
Enabling tuning from QA-Board
Tuning parameters that will be merged into context.params and appended to context.configs: in most cases you don't have to do anything special
1. Build artifacts
You must have defined and be using artifacts
2. Distributed task queue
You need to configure a task runner, that will execute tuning runs asynchronously. QA-Board ships with a celery integration so you'll just have to register a "worker" to get started. Read more here!
The QA-Board server starts tuning runs with the runner chosen by its QABOARD_TUNING_RUNNER environment variable: local (default, on the server itself), celery or lsf (via QA_RUNNERS_LSF_BRIDGE). See the server's environment variables.
3. Logged-in users
Starting tuning experiments requires a logged-in user, and runs are started as that user. See user management.
Tips for users
How to start runs is described in the user guide. A few shortcuts:
- To start from an existing run's parameters, hover its configuration tags and choose Copy full config in tuning format, then paste it in the manual tuning editor.
- Pasting lines of
key=valuein the manual tuning editor converts them to the tuning format:block.threshold=10becomes"block.threshold": [10], and space-separated matrices like[1 2 3]become JSON arrays. - In the Available Tests view, where you can define your own batches, Ctrl+S (or Cmd+S) saves the batches file you are editing.
- Once runs are done, the Analysis view (
selected_views=optimization) shows the tuning exploration plots: sensitivity to each parameter and to pairs of parameters (box plots, contours), a parallel coordinates plot, the trade-off between two metrics, and forqa optimizeexperiments the best parameters and the convergence. See the user guide.
Other tuning workflows
Tuning from QA-Board runs the code of a commit. Depending on where you are in your work, other workflows fit better:
- Locally, with your own tools: if you already have great development and debugging tools (an IDE,
tensorboardfor neural networks, one-off scripts...), keep using them. It's still worth having them call your code throughqa, so that runs behave the same everywhere: see debugging with IDEs. - Your local code, results in QA-Board: tweak, compile and run your code, then compare the results across runs in the web app. Runs started with
--shareappear in a batch named after you, with a warning that they may not match the committed code:qa --share run [...]qa --share --label testing-some-logic-tweaks batch [...] - Commit, CI, QA-Board: to change configuration files that live in your repository, commit and push the changes, and look at the results of the CI runs.
- Automatic optimization: let
qa optimizesearch the parameters for you, see auto-optimization.