Debugging QA-Board' runs in an IDE
How to debug runs
In most cases you want to debug code and set breakpoints inside your run() function. That means you want to debug individual runs, not a whole batch.
If you try to debug the qa batch command, your debugger will not be able to attach to the runs. Those at best will happen in a different subprocess (if using qa batch --runner=local), and at worst on a different computer (if using distributed job schedulers).
To know what qa run command you need to debug, you can:
- Look at the logs of your run in the web UI: it's at the top.
- Run
qa --dryrun batch xxxxto just print the individualqa runcommands executed in a batch.
Debugging with PyCharm
Edit your "debug configurations" like this:
- Module name:
qaboard(make sure you select "module" not "script" in the dropdown menu). - Parameters: CLI parameters for
qa:run -i images/A.jpg. Don't writeqa, and make sure you debug aruncommand, not a batch. - Working directory: Check it’s defined as the directory with qaboard.yaml. If this directory happens to have a subfolder named "qaboard", use it.
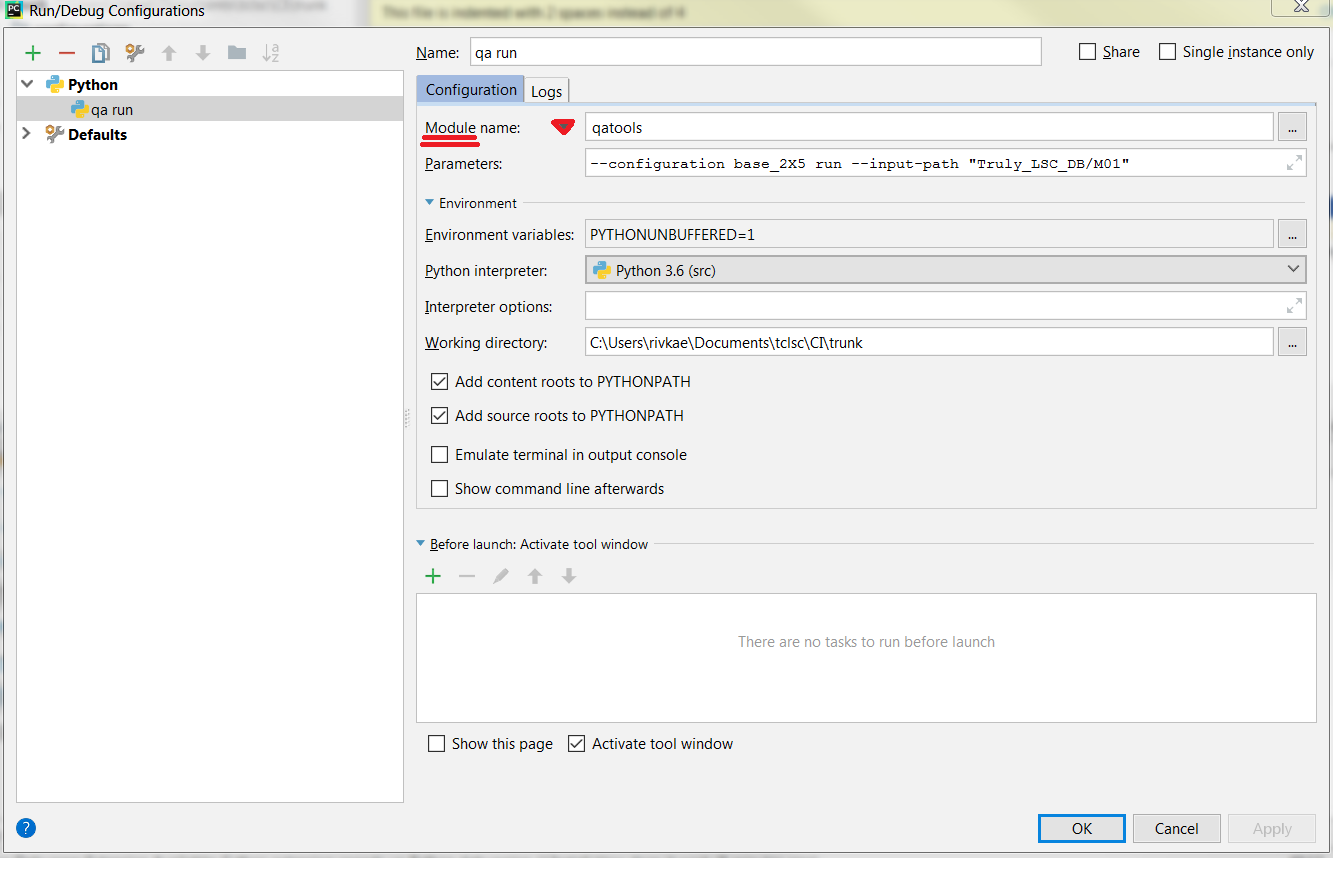
In some cases you'll also need to define as environment variables
LC_ALL=en_US.utf8 LANG=en_US.utf8
Debugging with VSCode
To configure debugging, the editor opens a file called launch.json. You want to add configurations that look like those:
{
  "name": "qaboard",
  "type": "python",
  "request": "launch",
  "module": "qaboard",
  "args": [
    "--help",
  ]
},
To debug qa run, for instance:
  "args": [
    "--database",
    ".",
    "run", // don't debug "qa batch" command
    "--input",
    "images/A.jpg",
  ]
Don't start args with "--": qa now treats everything after -- as arguments forwarded to your code, so the command would be ignored.
Here is a more in-depth review of your options at https://code.visualstudio.com/docs/python/debugging