History
The History page shows how metrics evolved over the commits of a branch, run by run. Use it to answer "when did this get worse?" or "is this input getting better?".
Opening it
- From the commit list, click History in the sidebar. It opens the history of the branch you're looking at, or of the reference branch.
- From a commit page, click the name of a run on its card: you get the history of that input on the commit's branch, already filtered on it.
- Or go to
/<project>/history/<branch>.
From the History page, the sidebar has the project's navigation: the branch's commits, Code, Integrations and Milestones.
The top bar
- The date range and refresh button, like on the commit list. By default, the last 3 days.
- The batch selector: which batch to follow. CI by default.
- A filter box, with the usual syntax: path, configuration, platform, tag, tuning parameters (
key:value)...
The history is most useful on the CI batch, filtered on a few inputs. Filtering on a single input (by clicking a run's name) gives you its full story.
Performance over time
A chart with one point per commit, for the selected metric (pick another at the top left; the project's configuration chooses which ones are offered).
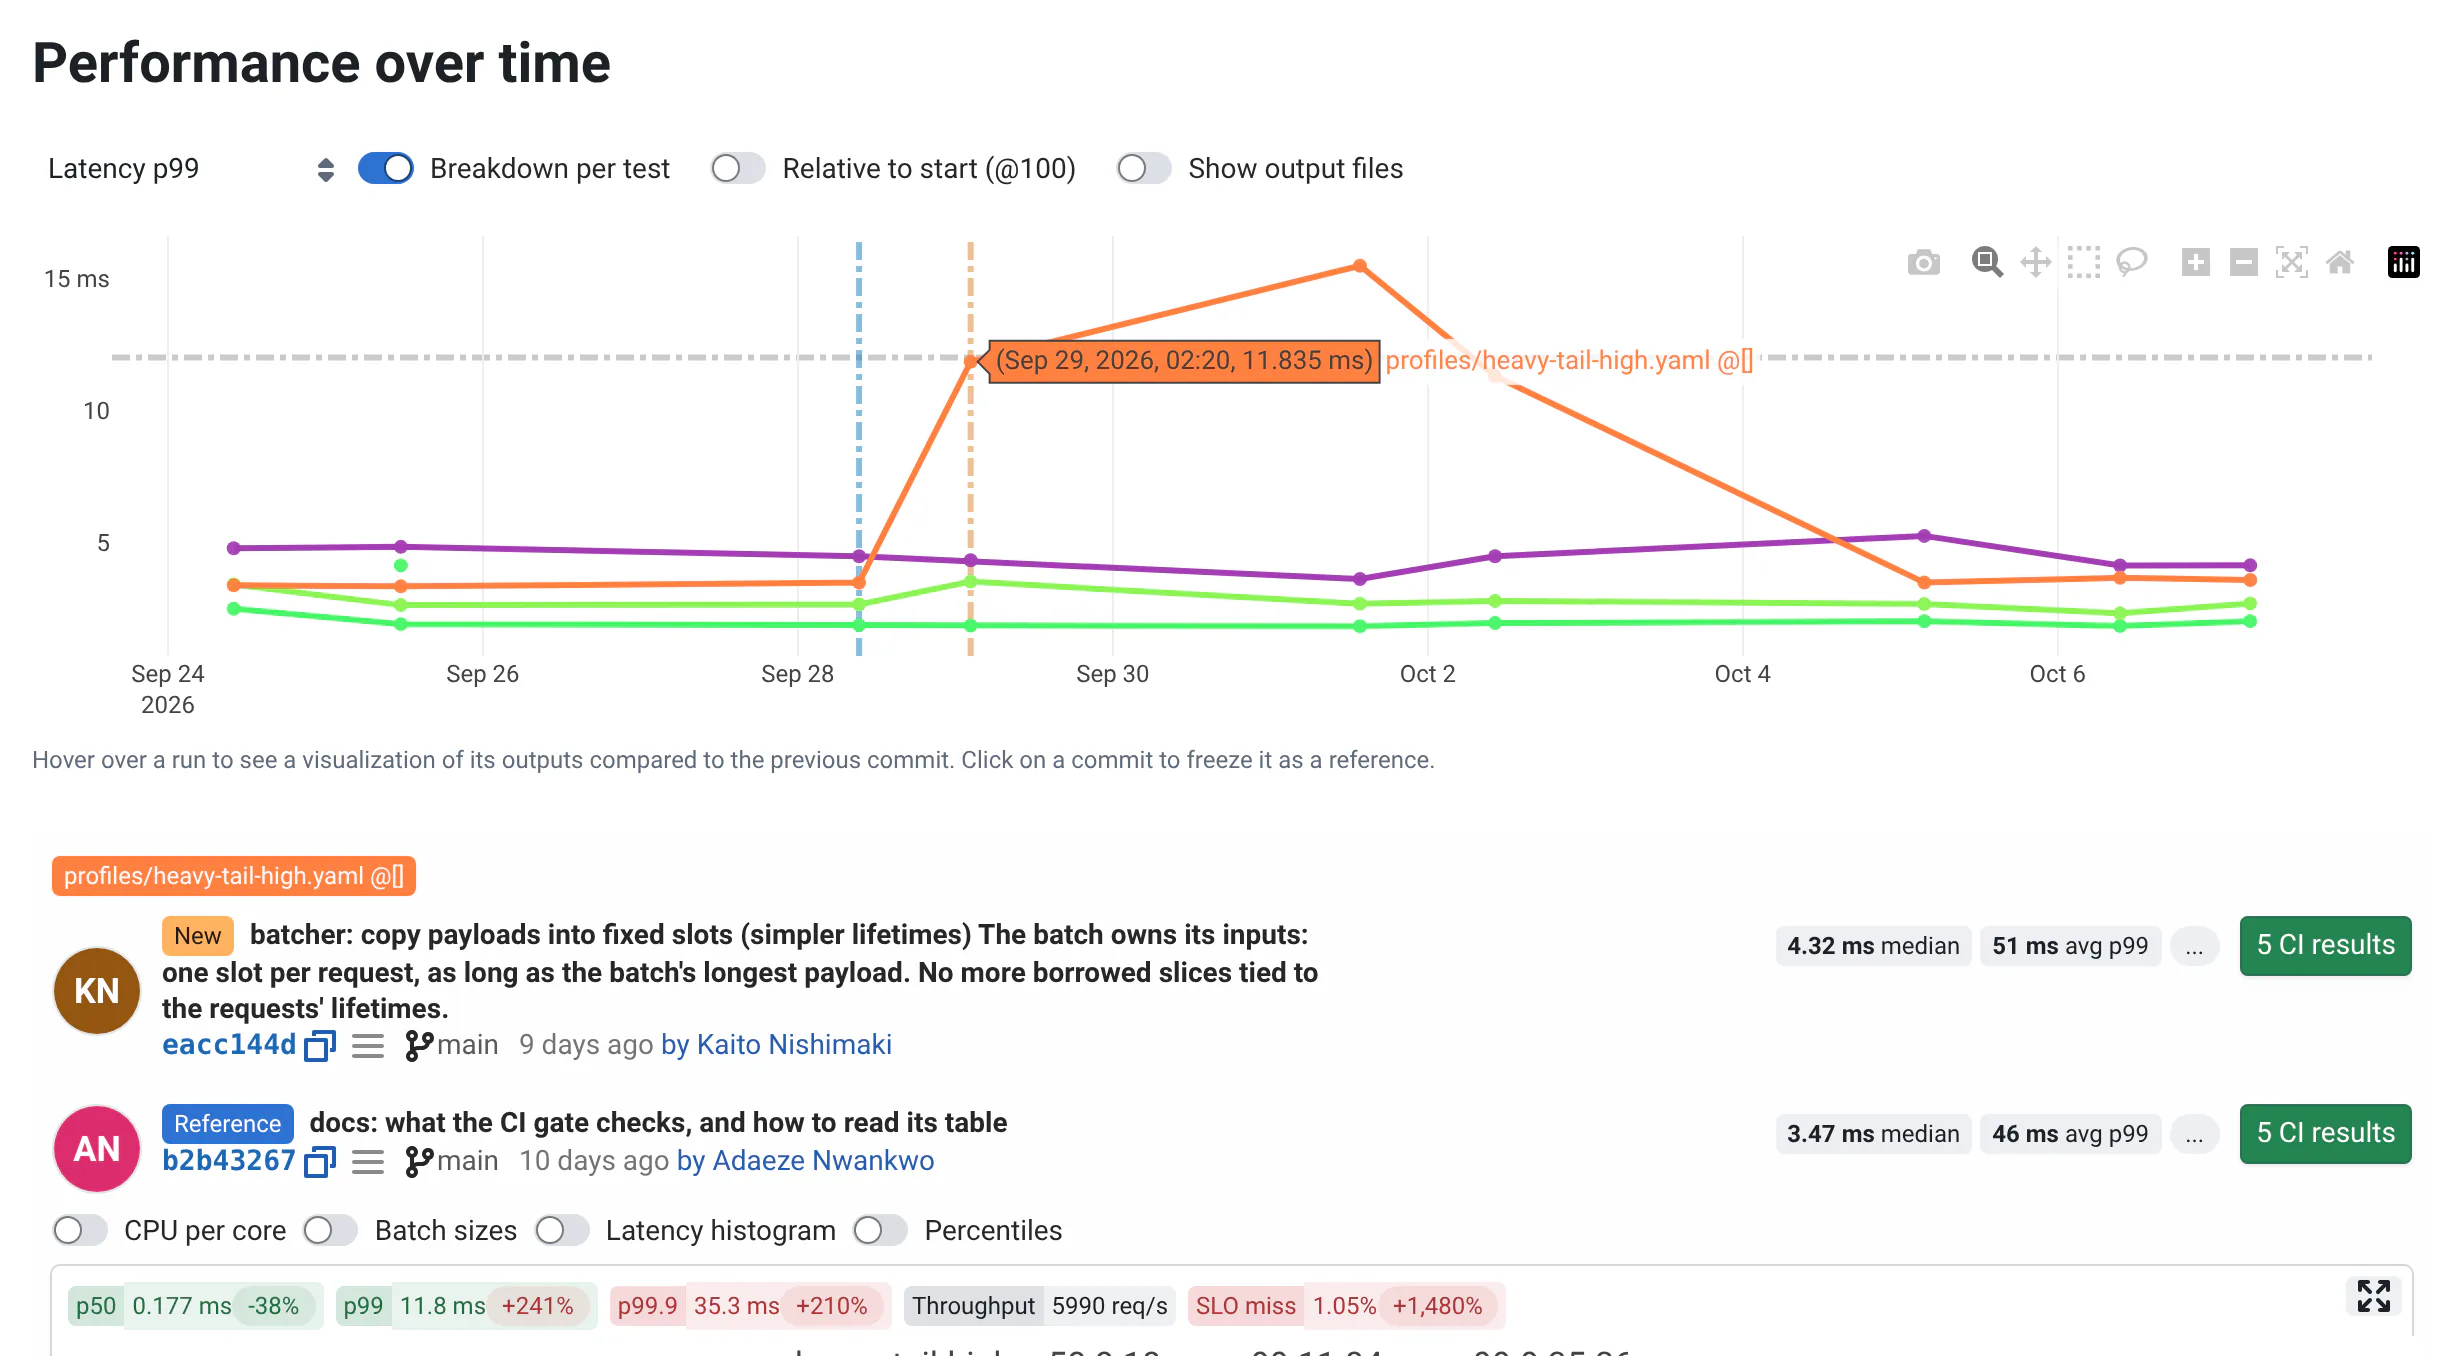
- Breakdown per test: one line per run (input and configuration) instead of a single aggregated line. Turn it off to see the median or average over all runs, but beware: commits may not have been evaluated on the same tests.
- Relative to start (@100): rescales each line so that its first value is 100, to compare inputs with very different values.
- Show output files: show the files a run created instead of its visualizations, in the panel below the chart.
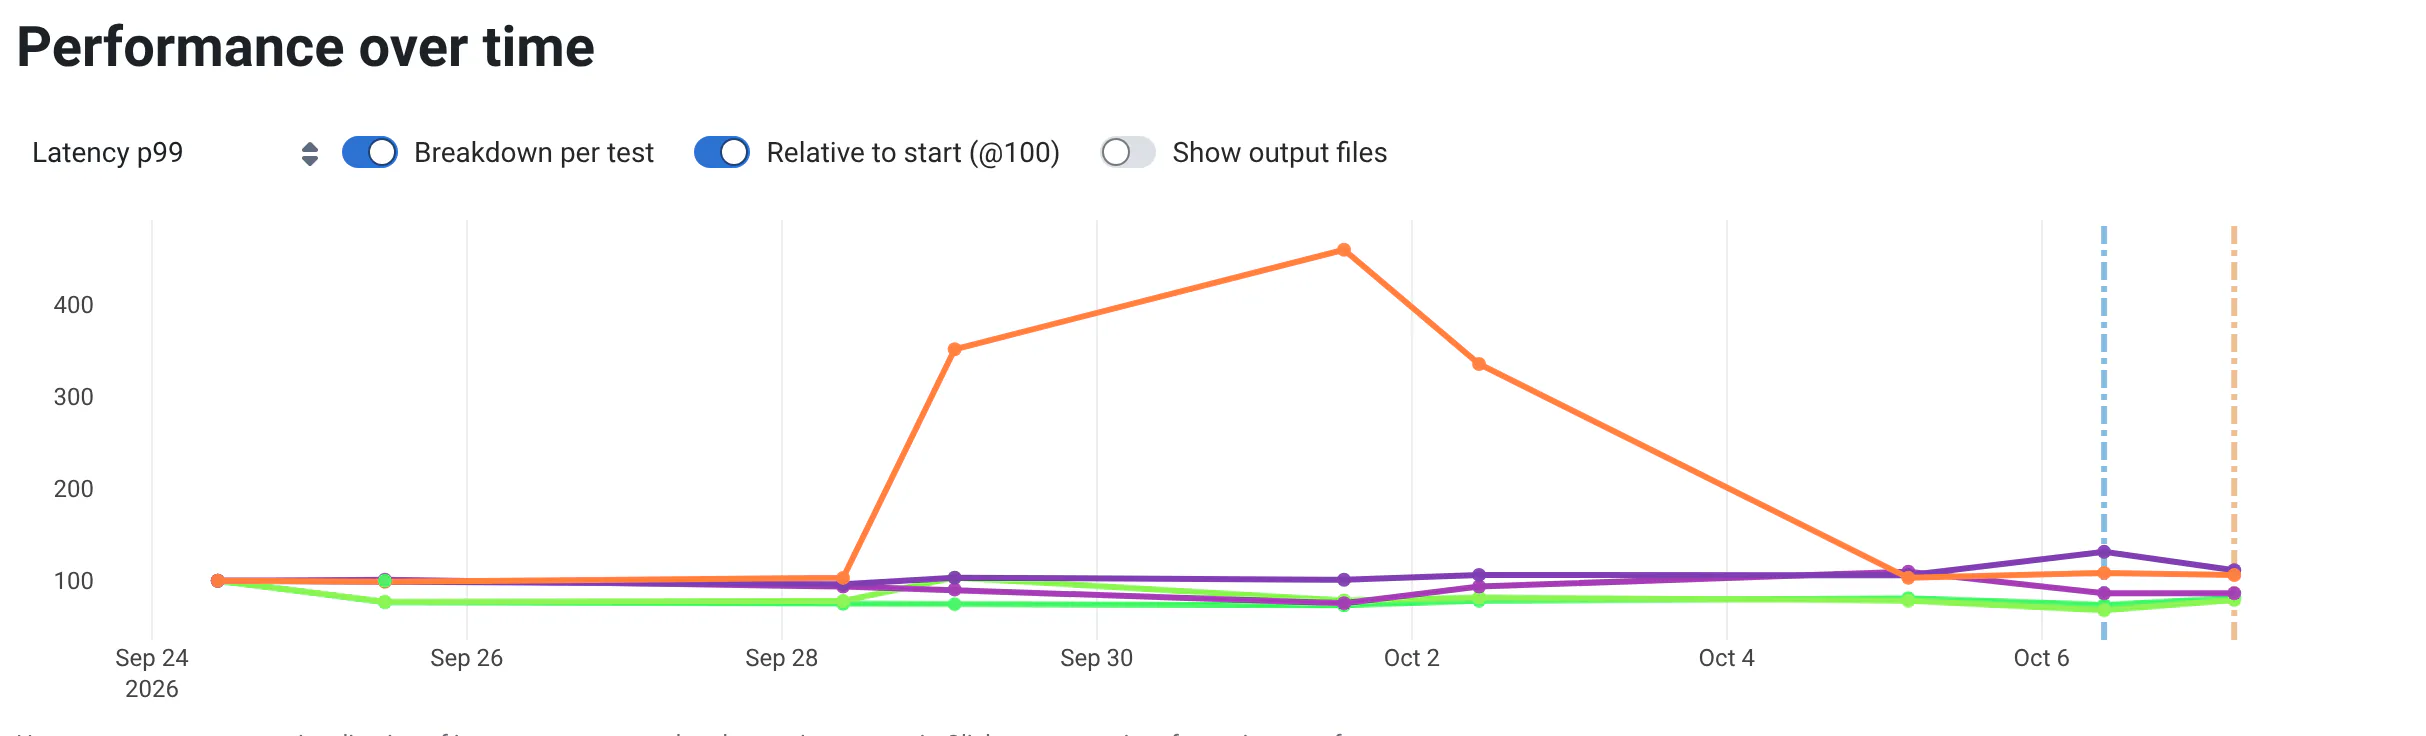
Below the chart, hover any point:
- the hovered commit becomes the New commit, and the commit before it on the line the Reference; both are shown as commit rows, with links to their commit pages.
- With Breakdown per test, a card shows the run's visualizations (or files), compared with the previous commit. Scroll the line to find where the output changed.
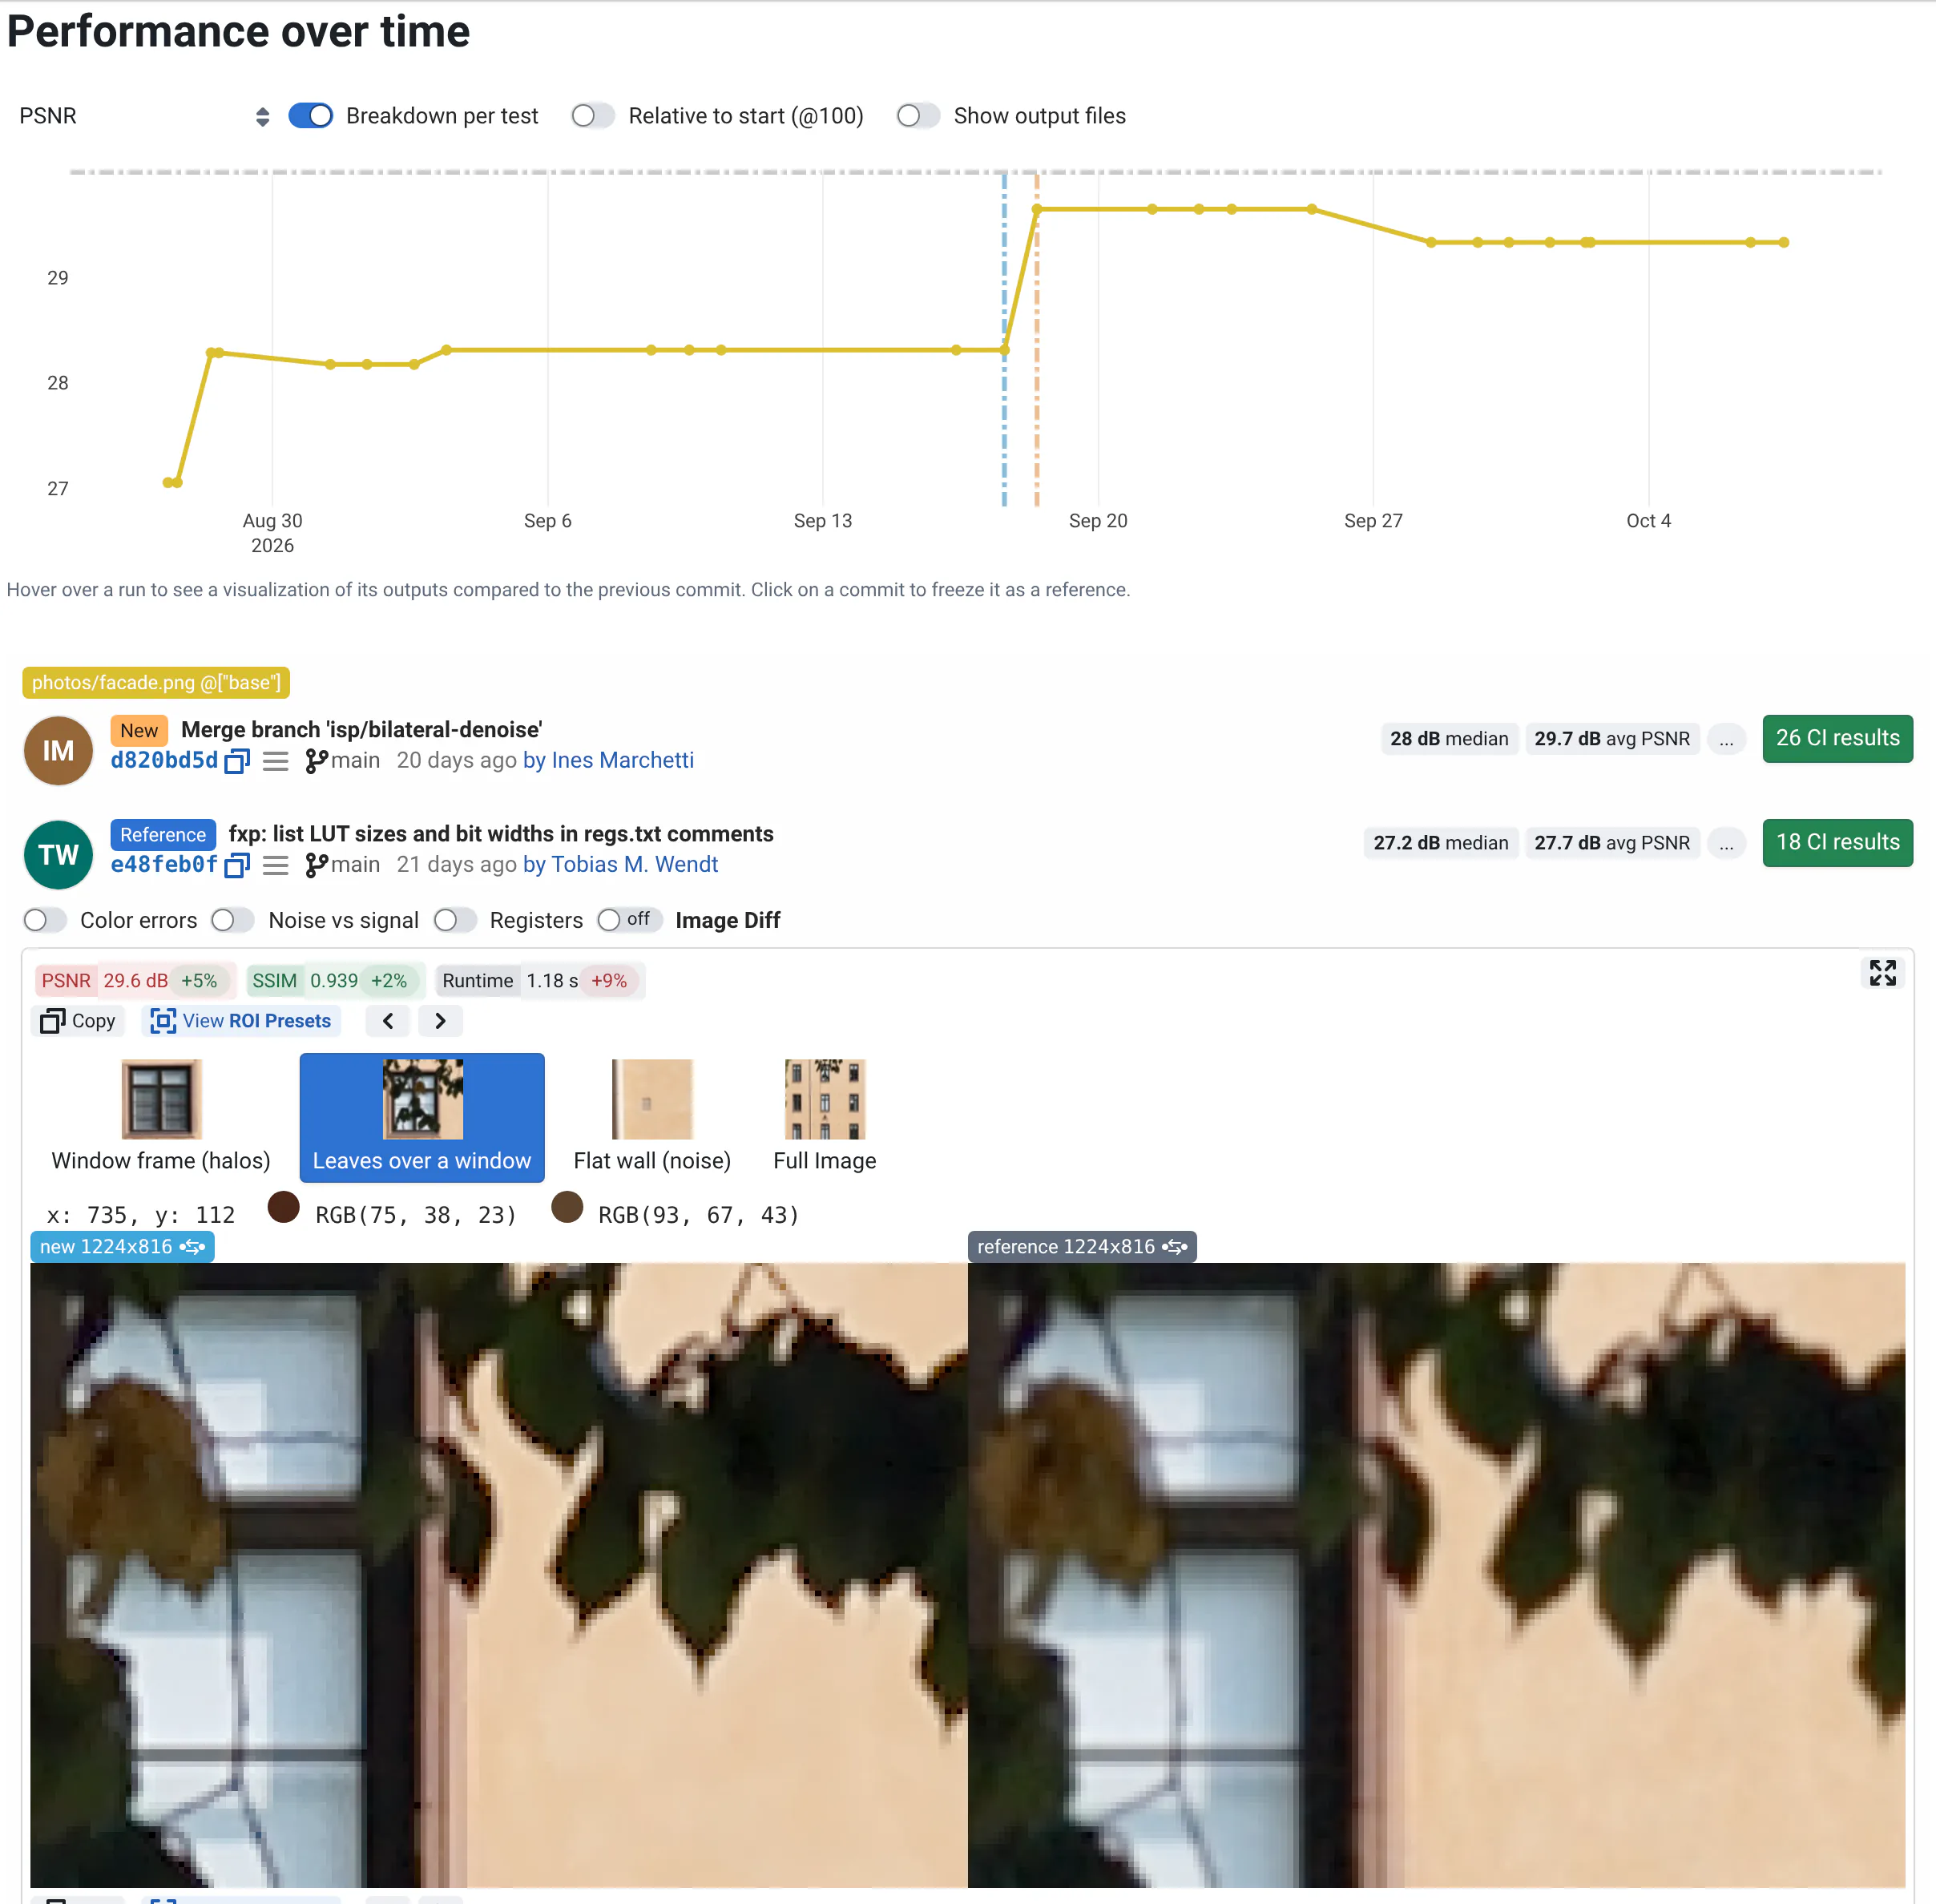
Click a point to freeze it as the reference, then hover other points to compare them with it. Double-click to unfreeze.
To find a regression, filter on the input that regressed, keep Breakdown per test on, and hover the line from right to left until the visualization changes.
The same chart, aggregated over runs, is shown at the top of each branch's commit list.
Metrics distribution and per-test tables
Below the chart, for the hovered (or selected) commit compared with its reference:
- Metrics distribution: the same summary as the commit page's Summary view, with medians, changes and box plots.
- Metrics per-test: the Metrics Table and Metrics Diff tabs, with options to sort runs by name, id or metric.
Pick which metrics to show with the metrics selector in the tables.
Sharing a history
The chart options (selected metric, aggregation, breakdown, relative scale, output files) and the filter are saved in the URL, so you can share the exact view. See Sharing.