Computing quantitative metrics
Algorithms are usually evaluated using KPIs / Objective Figures of Merit / metrics. To make sure QA-Board's web UI displays them:
run()should return a dict of metrics:
qa/main.py
def run():
    # --snip--
    return {
        "loss": loss
    }
- Describe your metrics in qa/metrics.yaml. Here is an example
qa/metrics.yaml (location from qaboard.yaml: outputs.metrics)
available_metrics:
  loss:  # the fields below are all optional
    label: Loss function     # human-readable name
    short_label: Loss        # somes part of the UI are better with thin labels...
    description: Mean error on the validation set  # shown in the metric's tooltip
    smaller_is_better: true  # default: true
    target: 0.01             # plots in the UI will compare KPIs versus a target if given
    target_passfail: false   # the UI will render the metric as green/red depending on above/below the target
    # when displaying results in the UI, you often want to change units
    # suffix: ''   # e.g. "%"...
    # scale: 1     # e.g. 100 to convert [0-1] to percents...
    # by default we try to show 3 significant digits, but you can change it with
    # precision: 3

# at the end of the file add your metrics to
# default_metric/main_metrics/summary_metrics
If it all goes well you get:
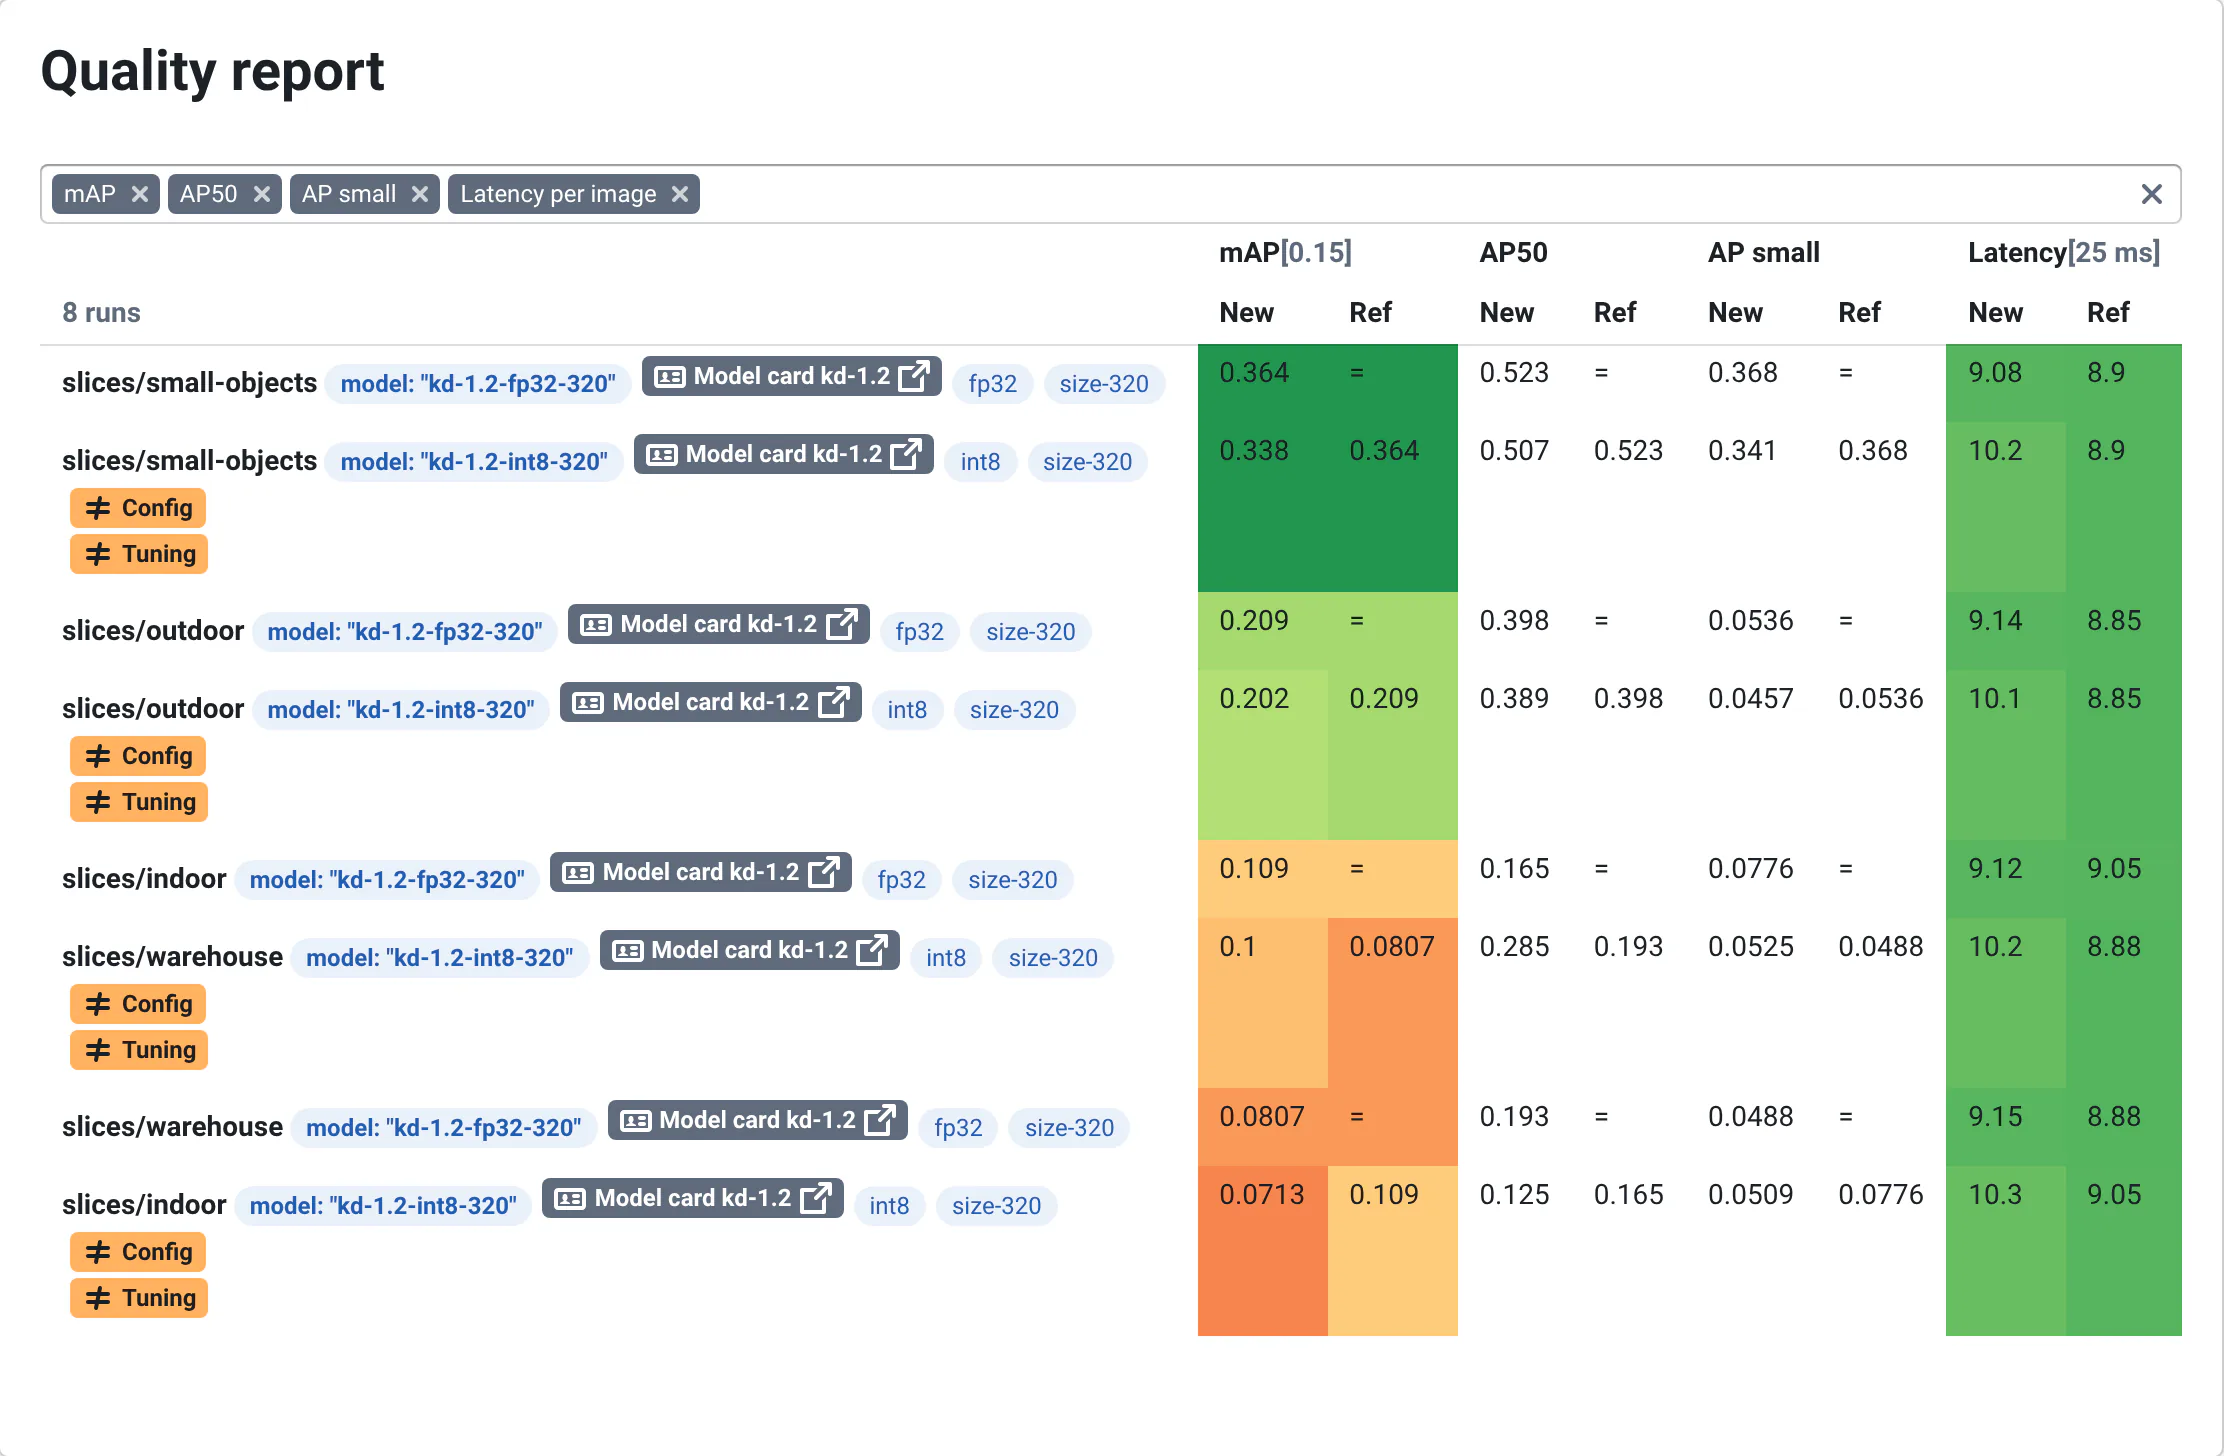
- Tables to compare metrics per input across versions, colored by their distance to the targets:
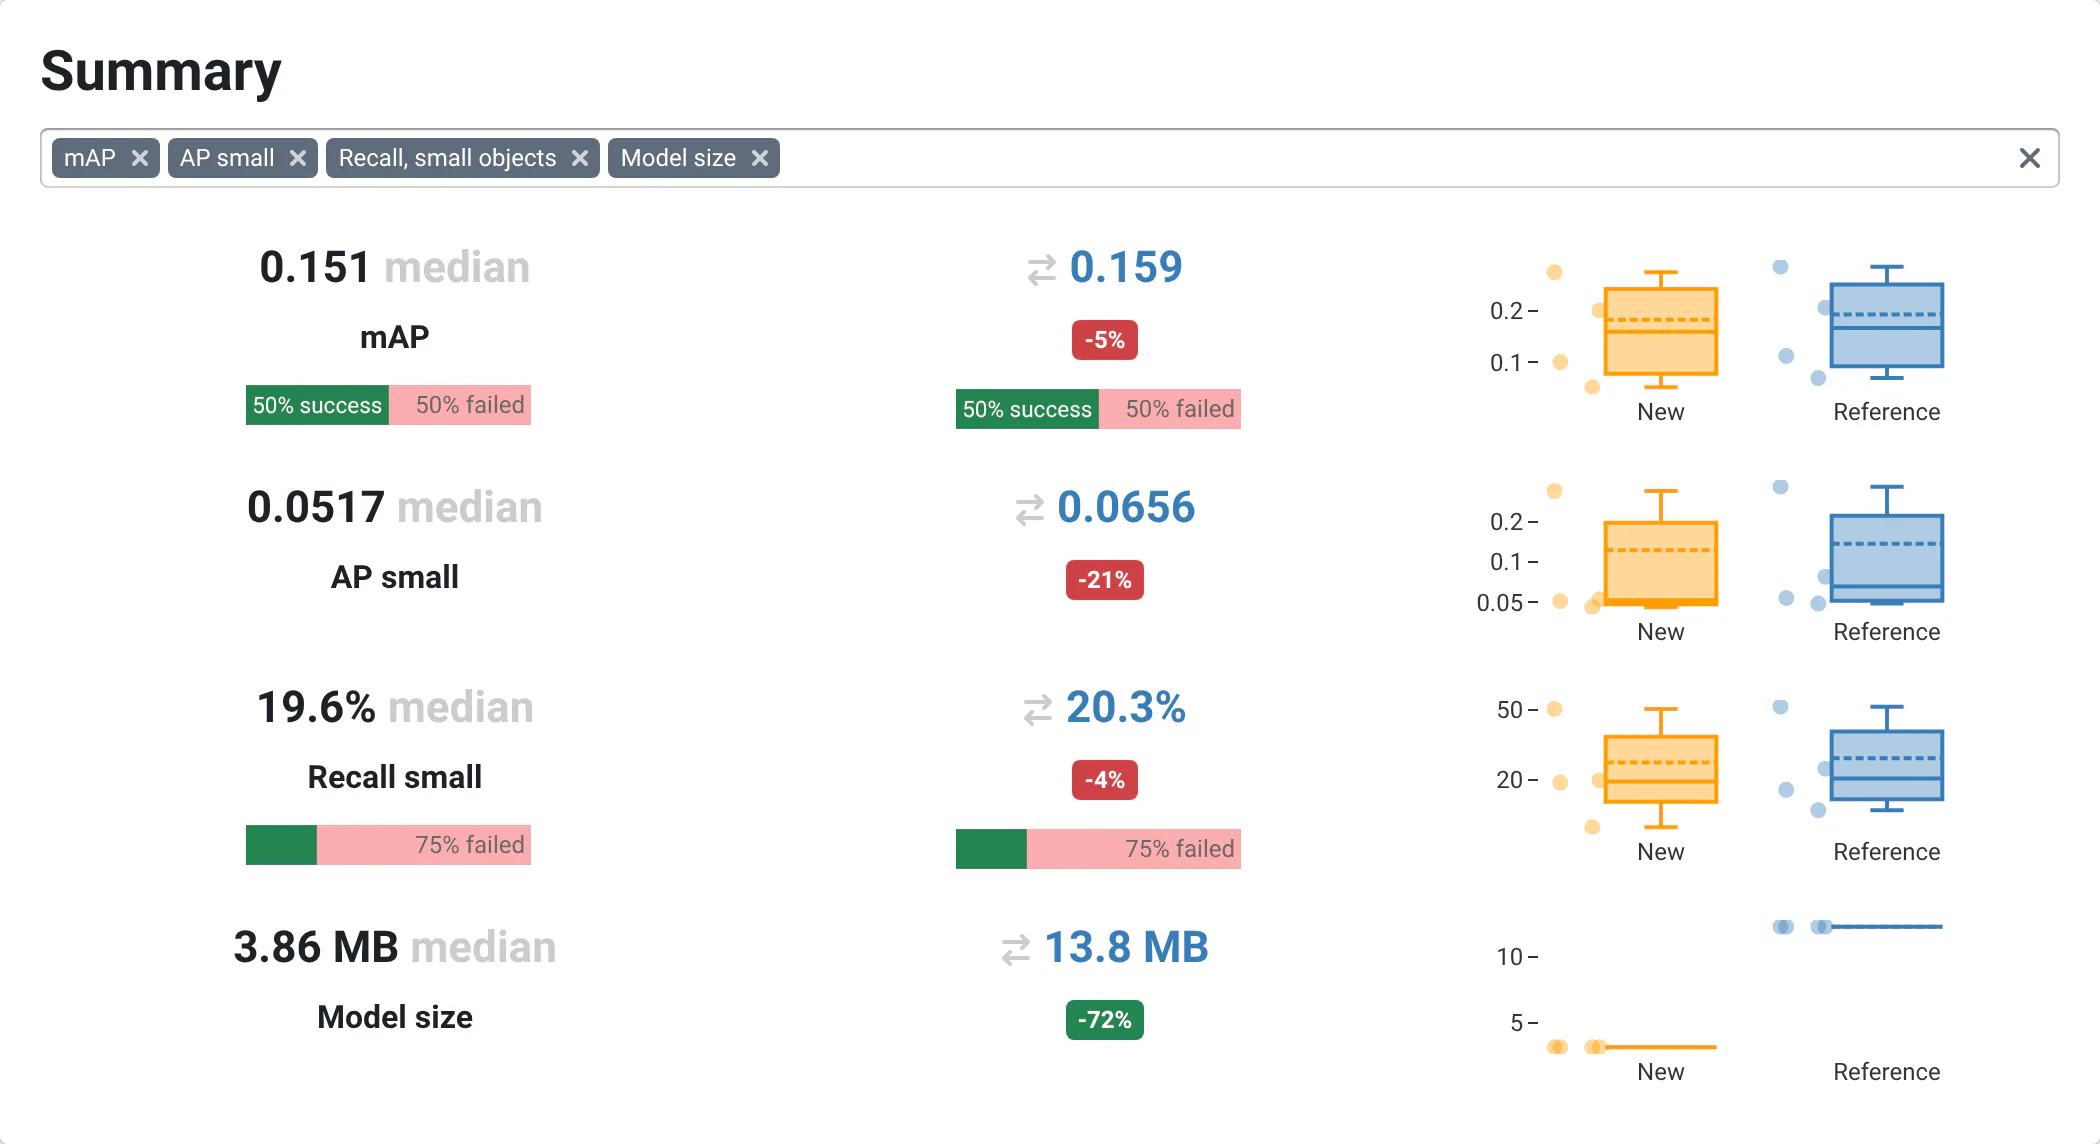
- Summaries:
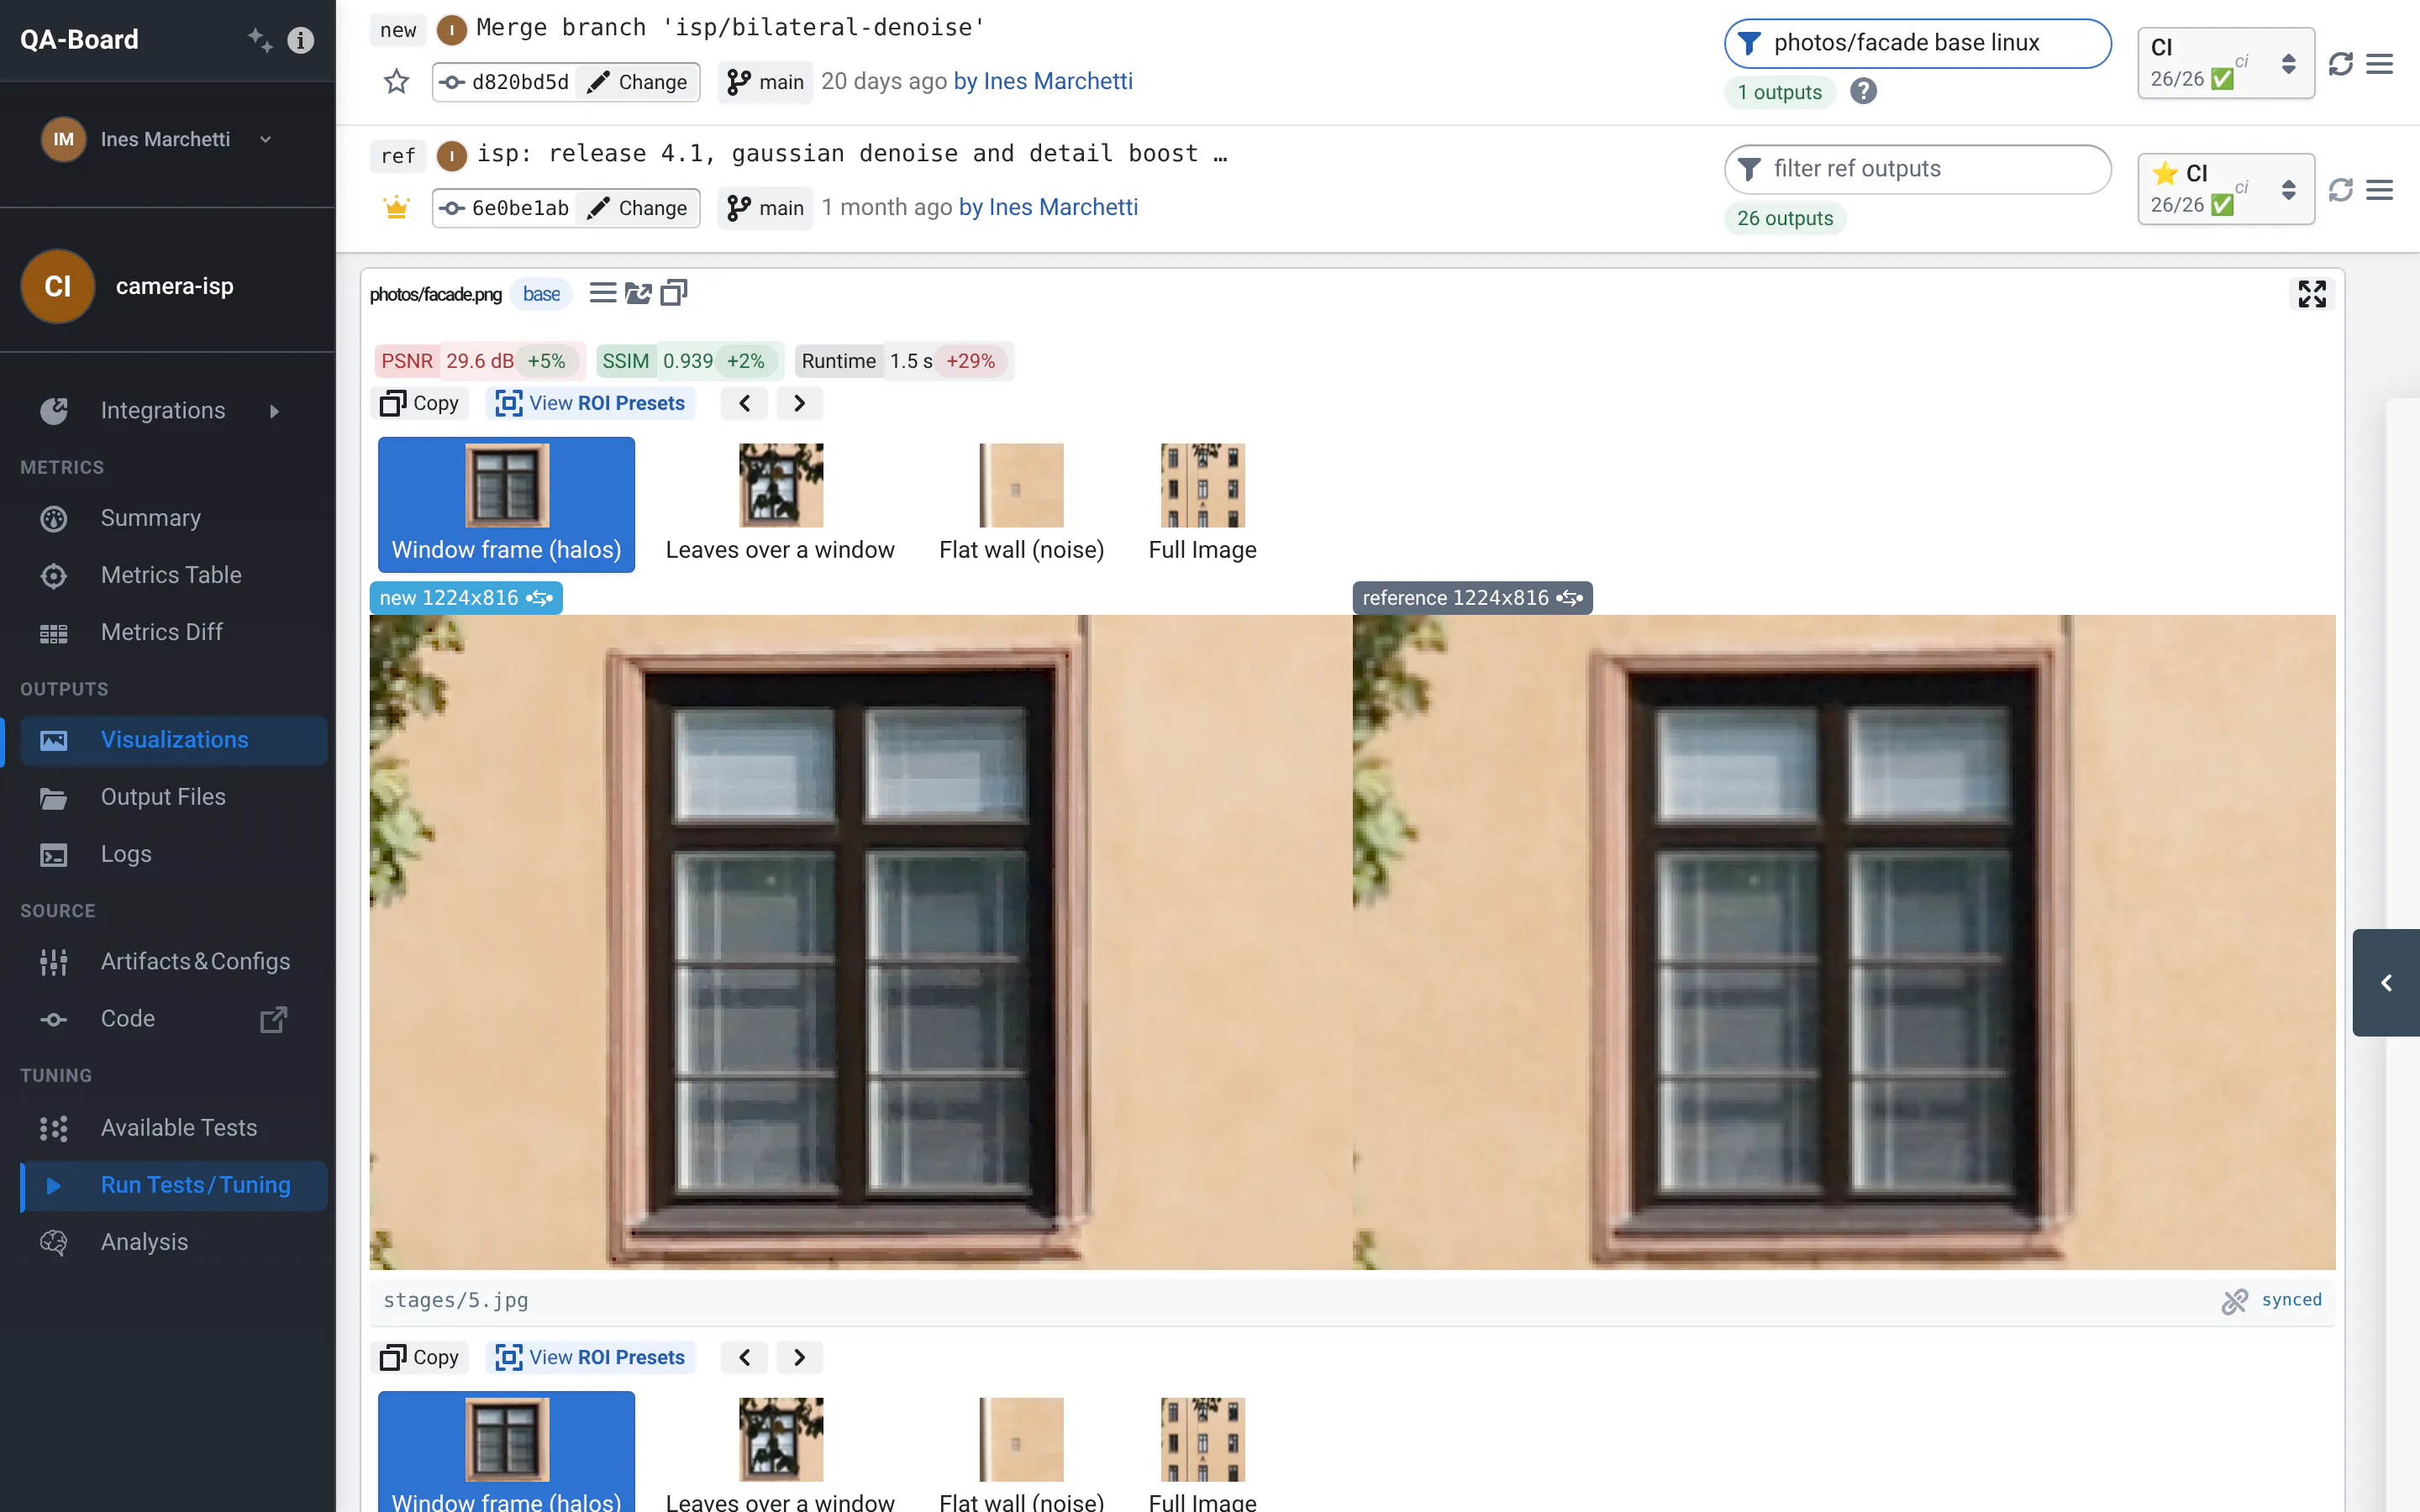
- Metrics integrated in the visualizations:
- and evolution over time per branch, in History.
note
We plan on not requiring you to define all metrics ahead of time...
Failed runs
The metric is_failed is boolean. If true, QA-Board will consider the run as "failed".
The main uses cases are:
- highlight in the UI
- failing runs that don't achieve a basic target quality (or where things just crash...)
- simplifying the control flow, instead of raising an exception from
run() - remembering if the
runwas successful, when users split betweenrun/postprocessstages
Rich metrics
If you return string metrics, they will be shown the UI's tables and cards like this:

You can return "rich" metrics to customize the display:
def run(context):
    # ...
    metrics = {
        "loss": 1.345, # regular metric, loss has to be defined in qa/metrics.yaml
        "status": "unstable", # string metric
        # you can have more complex metrics..
        "rich_status": {
            "text": "unstable",
            # link to somewhere
            "href": "https://example.com",
            "icon": "settings", # choose from https://blueprintjs.com/docs/#icons
            "intent": "WARNING", # or PRIMARY|SUCCESS|WARNING
            # the rendered "tag" supports all parameters of
            #   https://blueprintjs.com/docs/#core/components/tag
            # like "style" for CSS properties, large, minimal....
        }
    }
    return metrics
Metrics shown as a "run-time" configuration
It is possible to add at run-time parameters to the run. The use-cases are:
- making very visible a few key parameters nested deep in a config-file, and enabling filtering by them
- displaying links next to runs, grouped with the configuration (and not the metrics like above!). Users often use those badges to do deep-learning inference on QA-Board, and easily link back to the training page, managed by a different product. They'll give a model ID as configuration, their
run()will fetch the training page URL, and it enables smooth workflows.
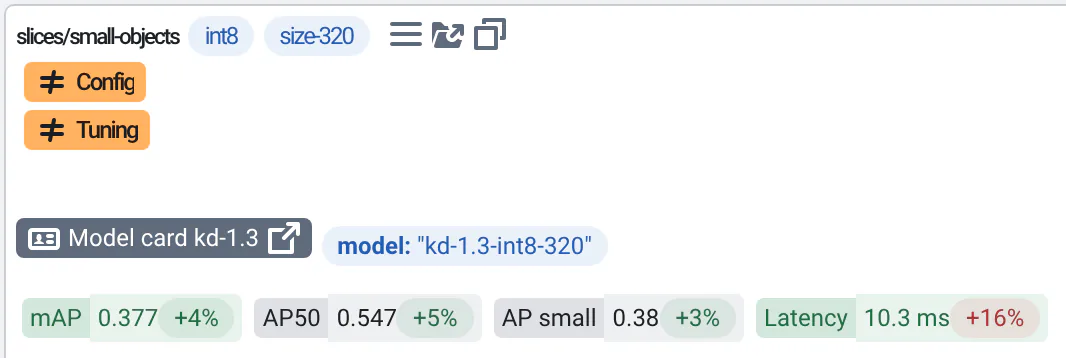
To make it happen, return in your metrics a params key:
def run(context)
    return {
        # ...
        "params": {
            # in the UI users will see "mode" as part of the run parameters
            "mode": "GAN",
            # they will also see a "badge" linking to the model training page:
            "badges": [
                {
                    "text": "Training",
                    "href": "https://wandb/run/<some-id>",
                    "icon": "settings",
                    # for more info on available key see above
                }
            ]
        }
    }