QA-Board
Algorithm engineering is hard enough.
Don't waste time with logistics.
What is QA-Board?
QA-Board helps Algorithms and QA engineers build great products. It offers powerful quality evaluation and collaboration tools.
What does it do?
Compare results between commits. Create advanced visualizations from your existing output files. Track metrics across time. Start tuning experiments.
How do I use it?
Run your code with a small CLI wrapper. You will see results from the web application.
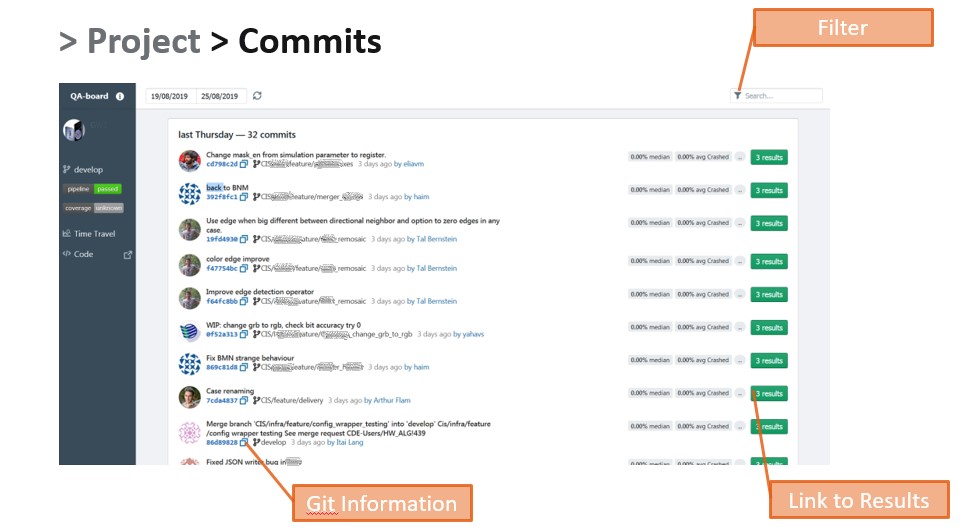
Organize & Share
Triggered runs from the CI or locally, and see them all in one place.
QA-Board is aware of version control; you can filter by commit, branch, author, message...
Always Compare
Whether you look at metrics or visualizations, QA-Board always compares each output to a reference version. You can save Milestones to benchmark new results.
You can compare configurations and filter results however you like.
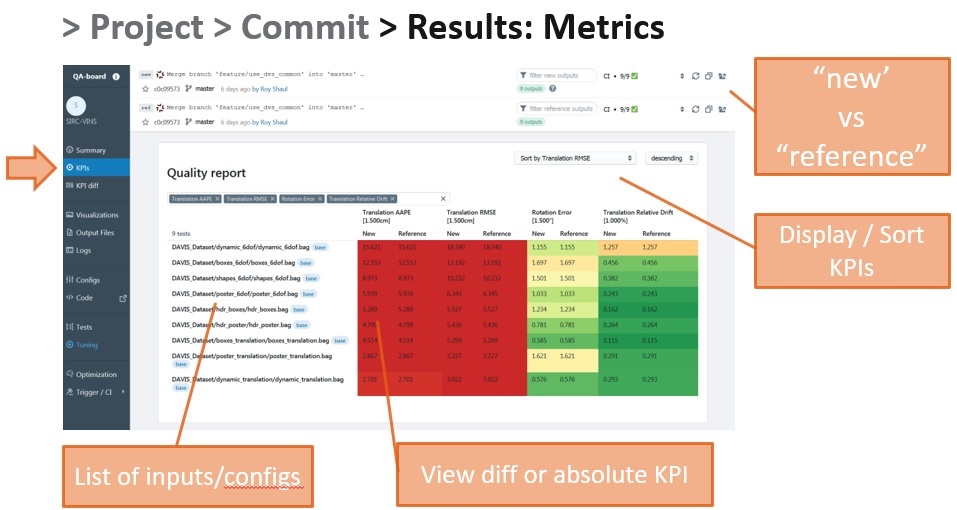
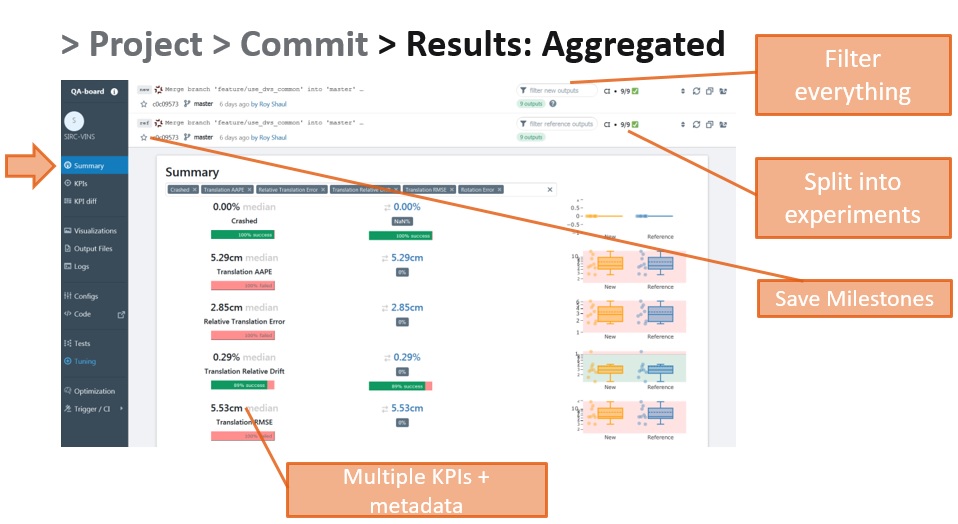
Rich Metrics
Real-world project need to look at heterogenuous KPIs: performance, quality, training time...
QA-Board lets you define as many metrics as needed, add metada (targets, label, units..), and can give you aggregated summaries as well as granular tables.
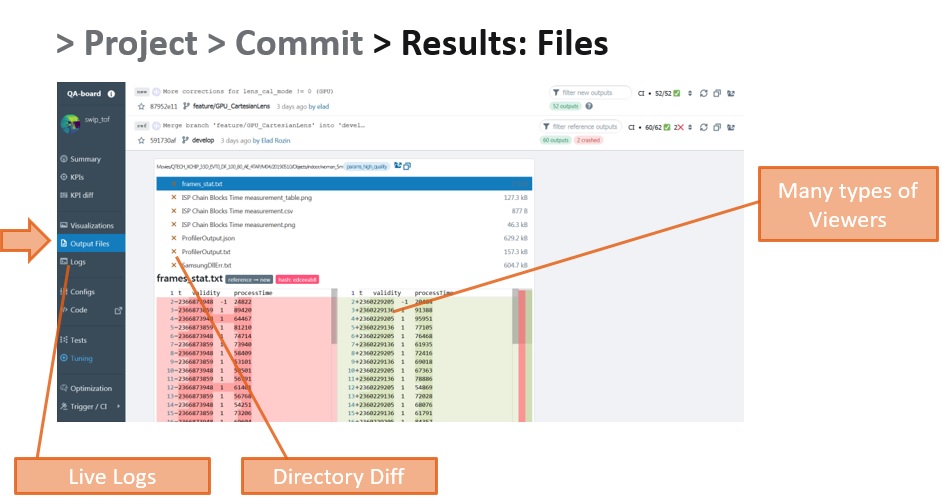
Output Visualizations
With QA-Board, each run dumps files in an output folder. When comparing results, you see a diff of all the files. Files are displayed with a wide range of viewers: first-party support for plotly, flame graphs, text, images, synced videos, 3d pointclouds, raw HTML...
You can declaratively create visualizations to show e.g. multiple images, debug data, sliders....
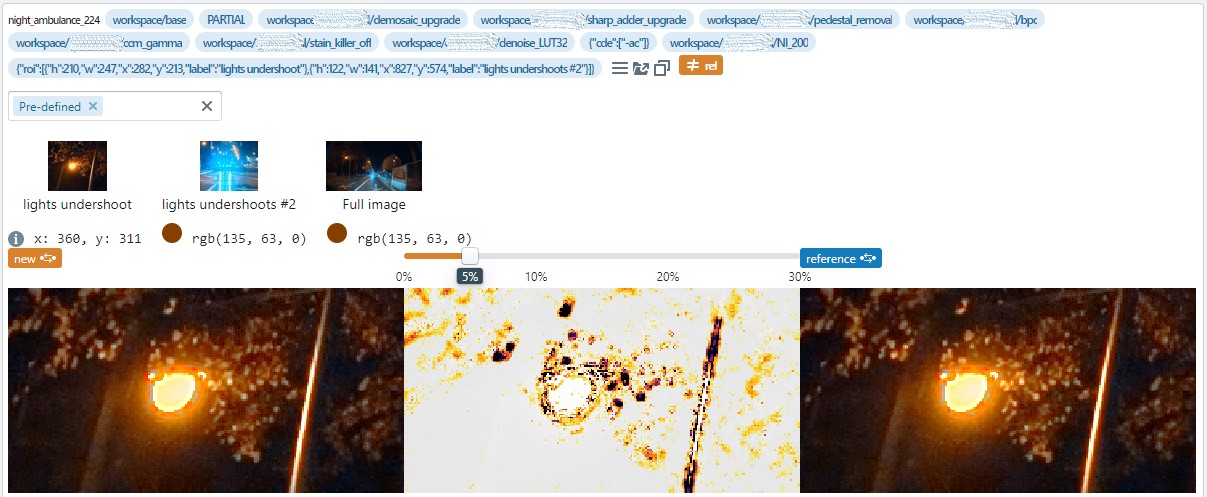
Advanced Image Viewer
QA-Board notably supports a performance image viewer based on OpenSeaDragon. At Samsung it lets use work smoothly with >100MP images.
Advanced features include showing perceptual differences, automatically finding interesting (or defining ahead of time) "Regions of Interest", use histograms, color tooltips and image filters.
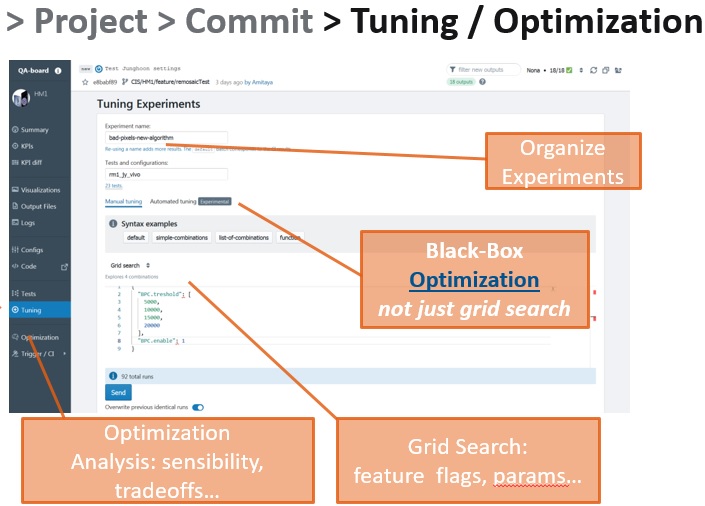
Tuning & Optimization
Define batches of inputs to run on files/databases that matter to you. Start tuning experiments to compare parameters or feature flags
Use Grid-Search or Black-box optimization (via scikit-optimize), and analyse trade-offs. Use common tools for distributed runs.
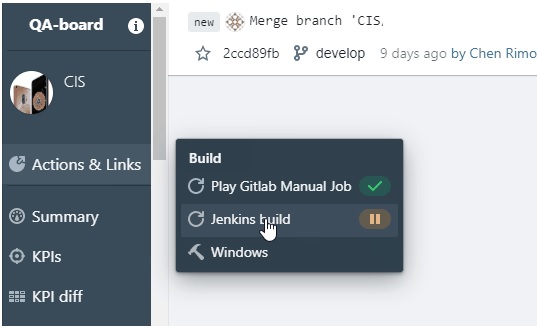
Integrations
From QA-Board itsef you can link to your docs, or artifacts. You can also add buttons to trigger 3rd party tools like Jenkins, GitlabCi, or webhooks. When runing during CI runs, QA-Board will update your CI tool with the run's status.
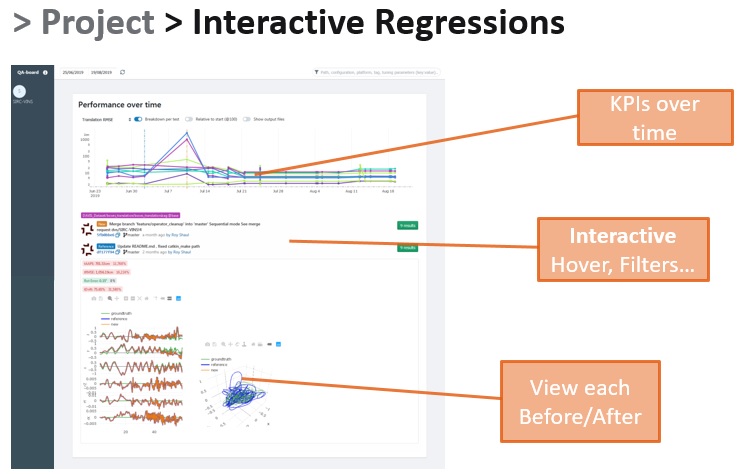
Regression Explorer
If a regression occured, you can simply quickly investigate when it happened, and diff the change.
More generally, QA-Board can be used for dashboard that show progress over time.
More features...
Mono-repo support, Bit-accuracy checks, Input metadata....