Many tools exist to investigate software performance. QA-Board can now use flame graphs to help identify bottlenecks, and pointpoint why regressions happened thanks to differential frame graphs.
If you are not familiar with flame graphs read this!
System requirements
- Install
perf.
# debian
sudo apt-get install -y linux-tools-generic linux-tools-$(uname -r)
# maybe also            linux-tools-common

# from source
git clone https://git.kernel.org/pub/scm/linux/kernel/git/torvalds/linux.git
cd linux/tools/perf
make

# install somewhere in your PATH
cp perf /somewhere/bin
- Install
FlameGraph. It turnsperfrecording into flame graphs:
git clone https://github.com/brendangregg/FlameGraph
cd FlameGraph

# make the scripts accessible easily
export PATH=$(pwd):$PATH
burntransforms the output fromFlameGraphinto a "portable" json.
# other options at https://github.com/spiermar/burn#getting-started
curl -L "https://dl.bintray.com/mspier/binaries/burn/1.0.1/linux/amd64/burn" -o burn
chmod +x burn

# install somewhere in your PATH
cp burn /somewhere/bin
Requirements for C/C++
- Your program needs to be compiled with symbols (
gcc -g, otherwise, have fun making sense of the adresses). If your're not sure callfile your-binary, it will tell you:
$ file my-binary
my-binary: ELF 64-bit LSB executable, x86-64, version 1 (SYSV), dynamically linked, interpreter /lib64/l, for GNU/Linux 2.6.32, with debug_info, not stripped
- Ideally, compile with
gcc -fno-omit-frame-pointeras frame pointers help create good stack traces. If you can't do it,perf --call-graph dwarforperf --call-graph lbrmay be workarounds...
It's also possible to build flame graphs for java, node...
Using perf to instrument a command
Read this article by Brendan Gregg to get an overview of perf's many uses and commands.
To profile a command:
perf record -F 99 -ag -- your-command
# -a: all CPUs
# -g: capture call graphs (stack traces)
# -F99: sample at 99 Hertz

# view a report with
perf report
note
perf may warn about you not having permissions to collect stats from the kernel. If it happens, either run as root with sudo or follow the instructions, likely involving CAP_SYS_ADMIN permissions for your users, and a <=2 policy in /proc/sys/kernel/perf_event_paranoid...
Read the docs to tweak profiles to your use case.
As-is,
perf's reports are great. The issue is that if you're investigating multiple feature flags, compilation options or code versions, you need a way to organize all this data. And obviously still have good investigation and debugging tools. That's the promise of QA-Board!
Flame graphs at last!
Create a flame graph involves lots of format conversion. You can create an SVG flame graph:
# use a text-based format for the perf recordings
perf script > out.perf

# this format makes filtering super-easy
stackcollapse-perf.pl out.perf > out.perf-folded

# create an SVG plot, already viewable
flamegraph.pl out.perf-folded > perf.svg
If you only care about some functions (e.g. what's under your main()), you can filter:
cat out.perf-folded \
  # our software has a bunch of irrelevant setup code
  | grep 'CCDECmdLineSim::RunChain' \
  # remove common frame prefixes
  | sed 's/;\[unknown\];__libc_start_main;main;CCDECmdLineSim::Run//g' \
  | tee out.filtered.perf-folded \
  # tons of options.. https://github.com/brendangregg/FlameGraph#options
  | flamegraph.pl --color hot --hash --cp \
  > perf.svg

# cleanup
rm out.perf out.perf-folded
QA-Board's viewer needs a more "portable" format, not an "finished" SVG:
burn convert --type=folded out.filtered.perf-folded --output=perf.flame.json
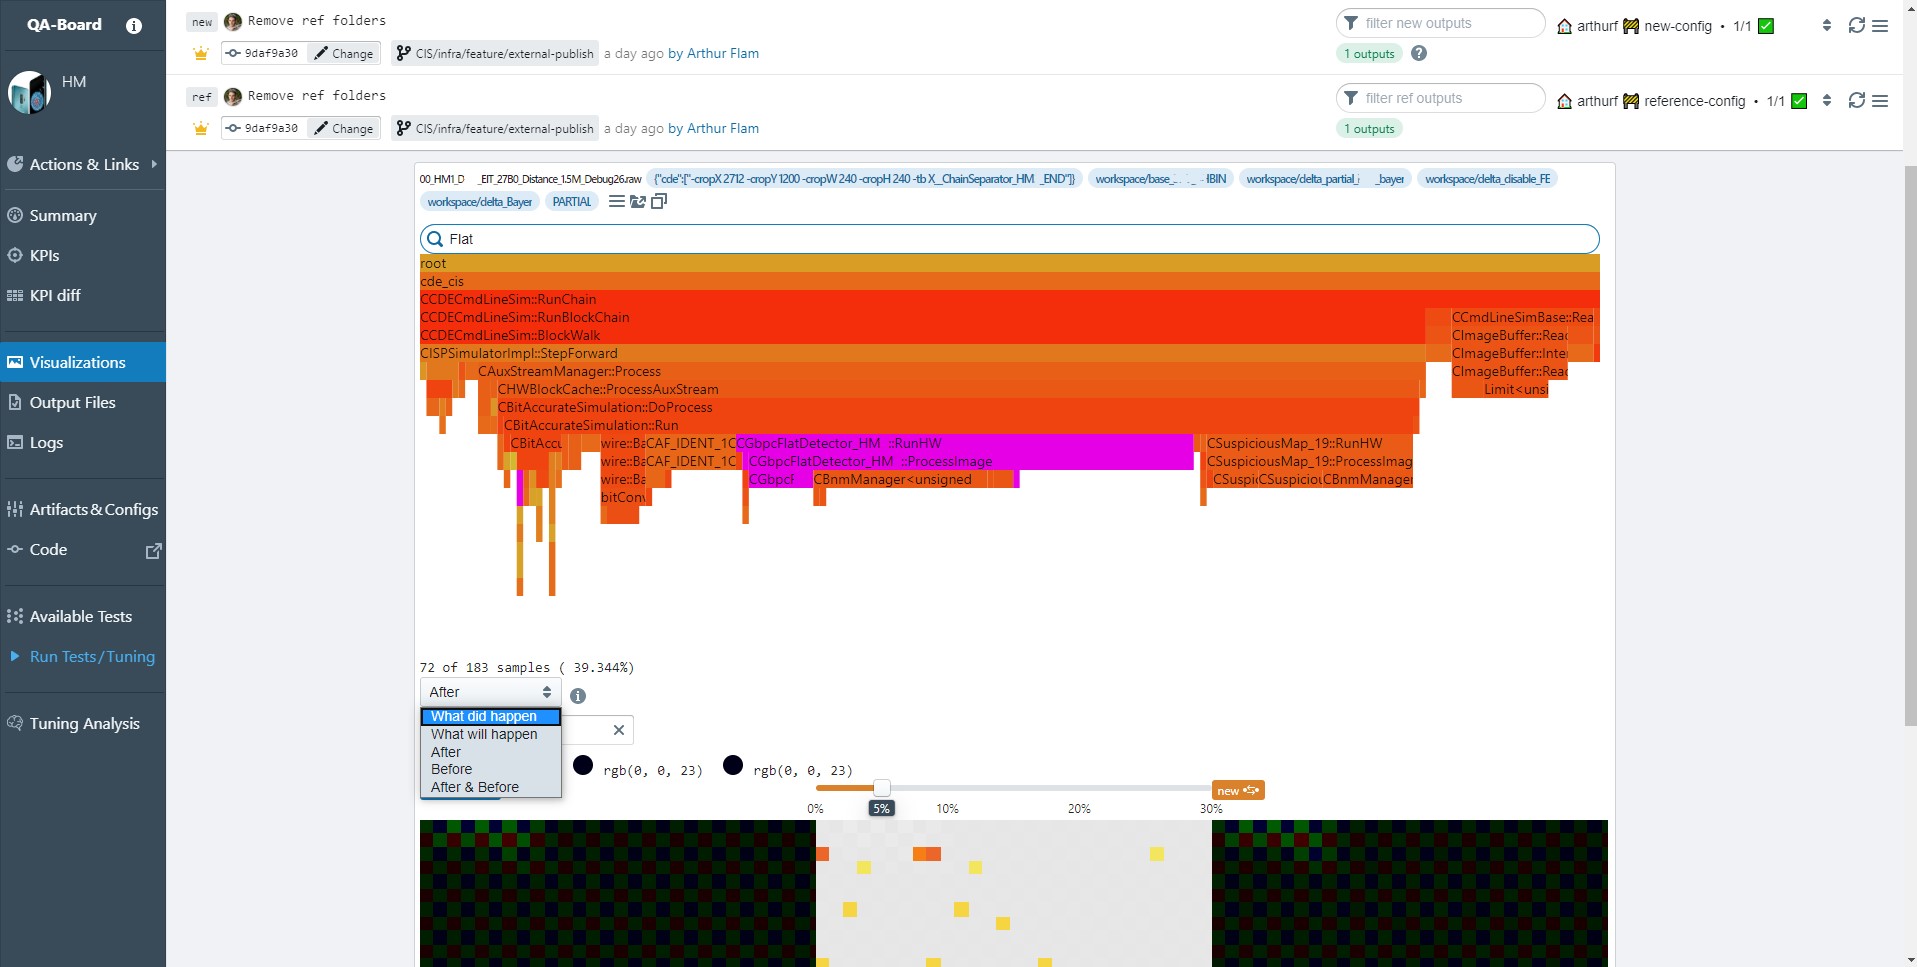
Visualizing flame graphs in QA-Board
QA-Board integrates Martin Spier's d3-flame-graph. At a glance, you can check where you code spends its CPU cycles, and use differential flame graphs to debug regressions. What do you need to do?
- Wrap calls to
perf& cie in yourrun()function:
def run(context):
    # run perf -- /some/binary
    # run stackcollapse.pl && burl -o {context.output_dir}/perf.flame.json
- Tell you expect to view flame graphs: QA-Board
outputs:
  visualizations:
  - path: perf.flame.json