Profiles and flame graphs
Record a profile in your runs, and see where the time went against the reference: the web app draws the new run's profile as a differential flame graph, colored by how each function changed, with a table of the top functions. Most profilers' files work as they are.
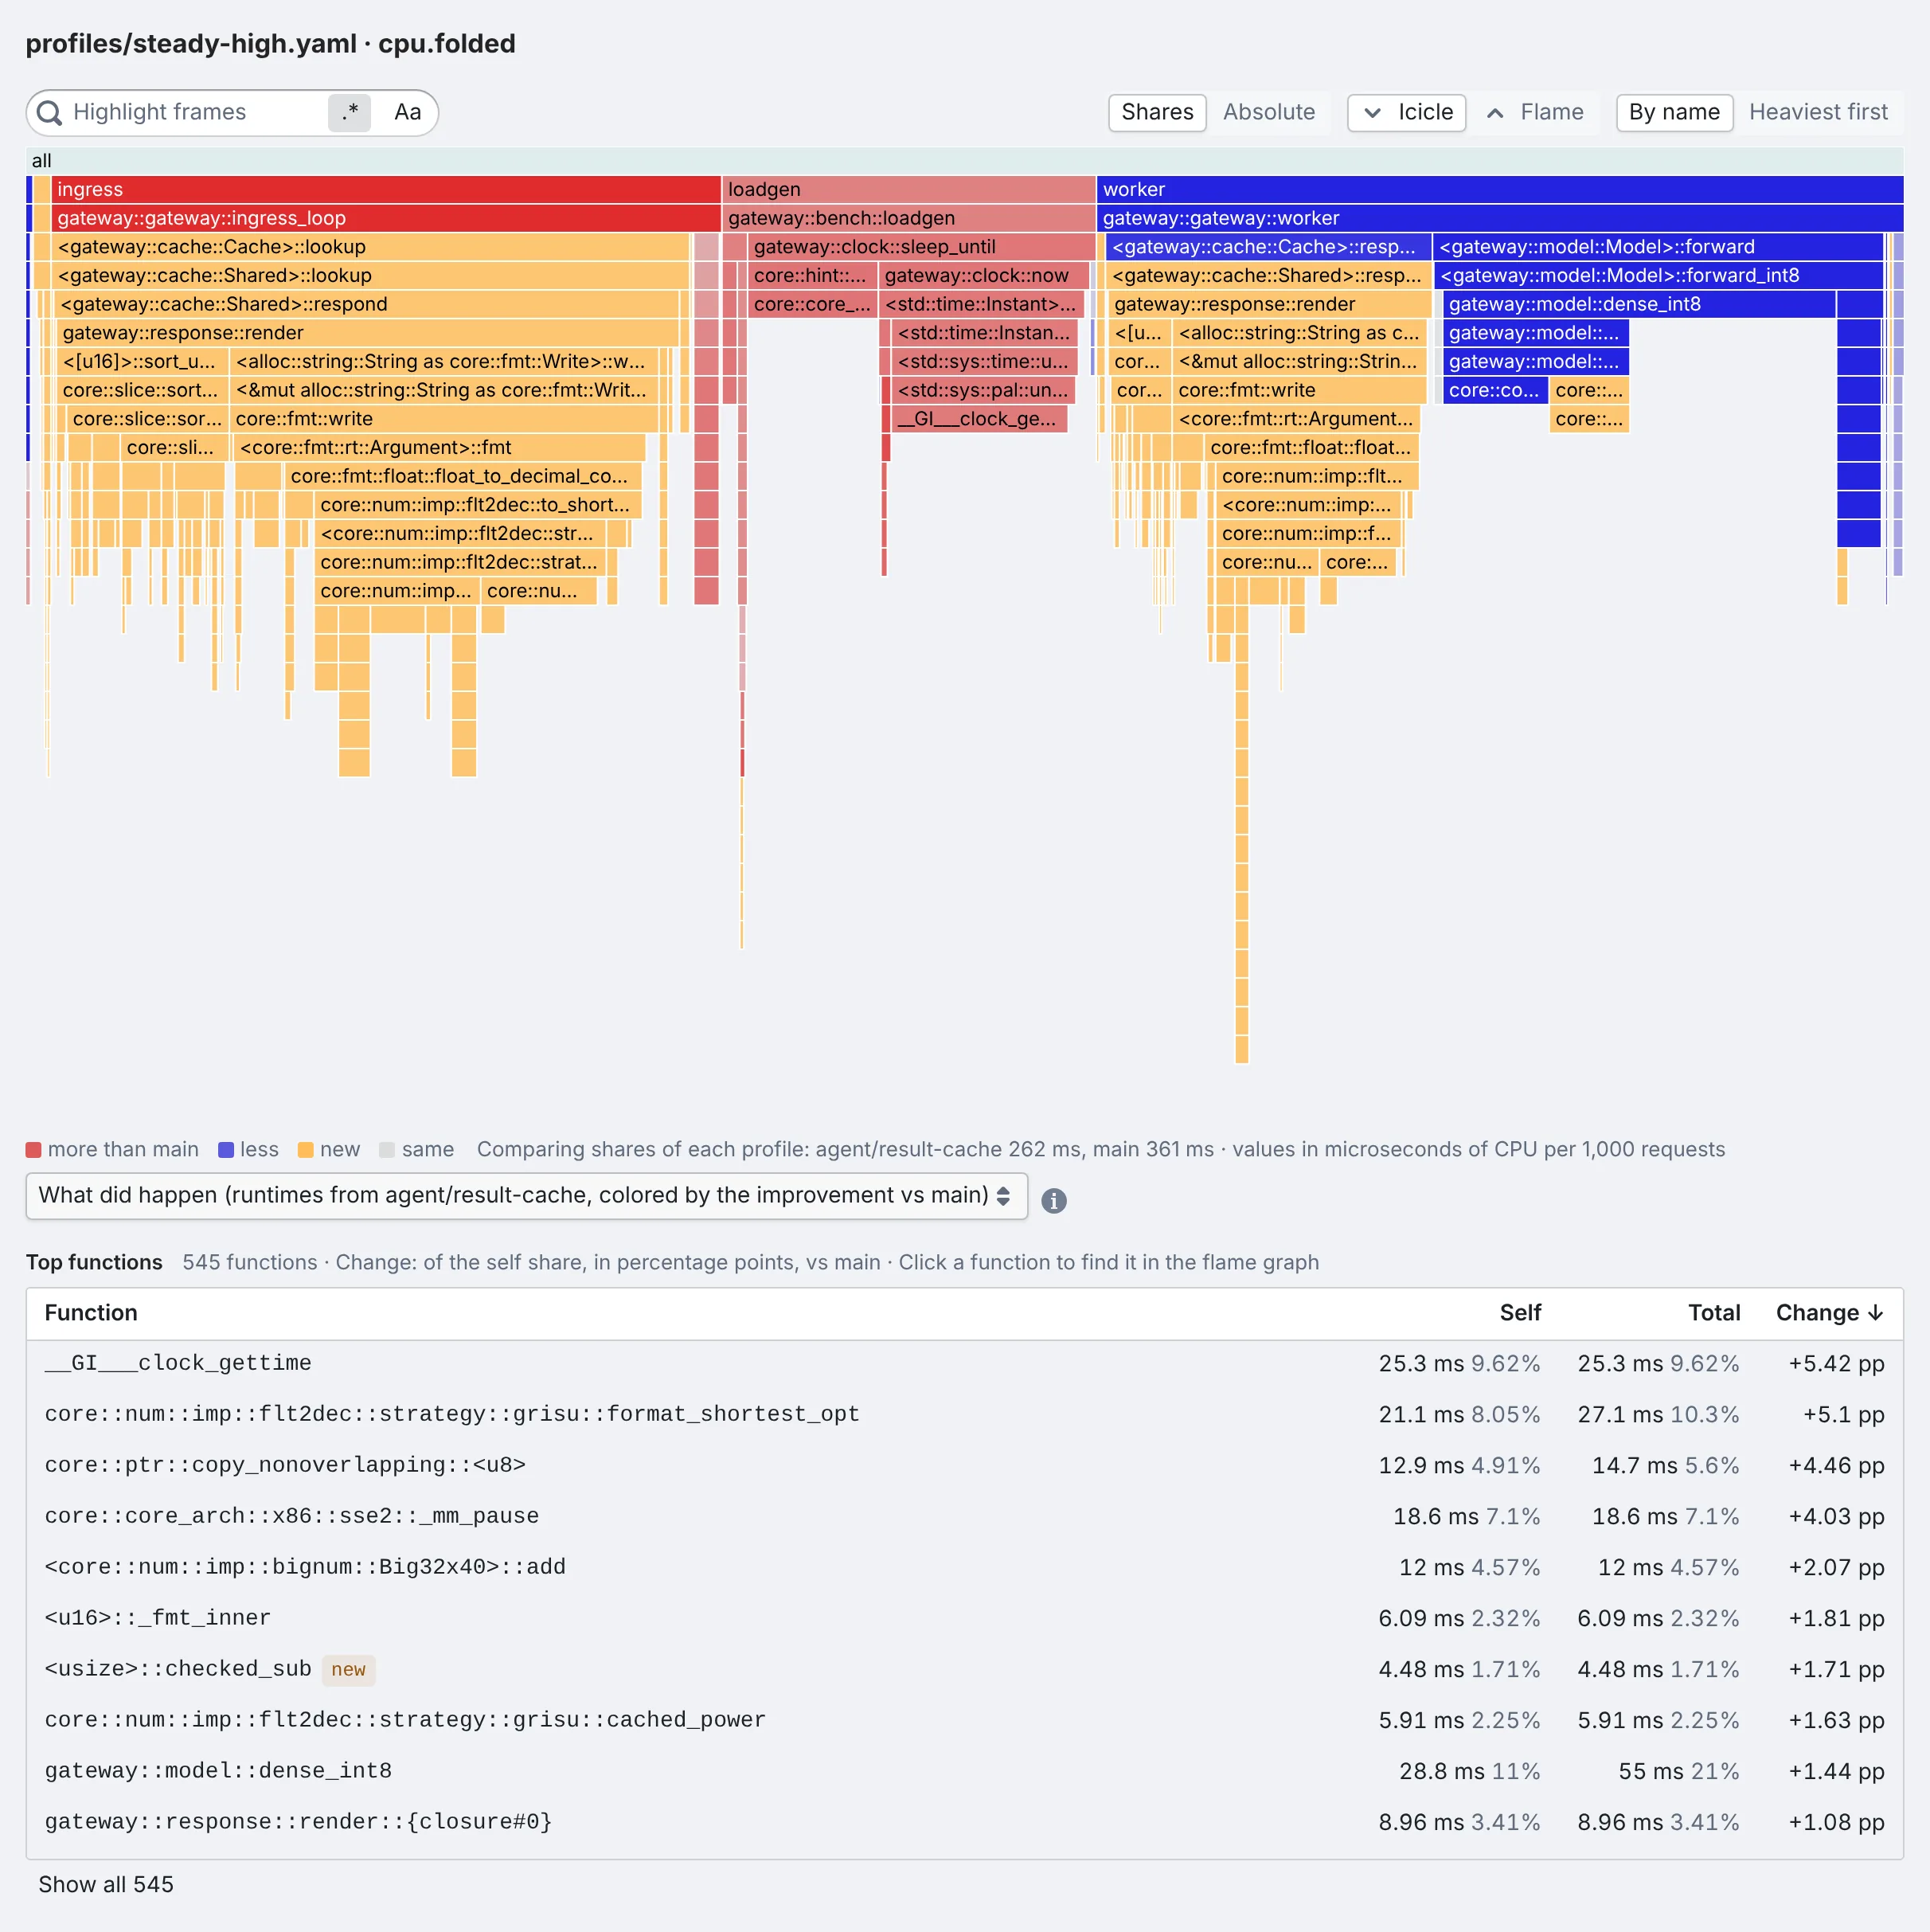
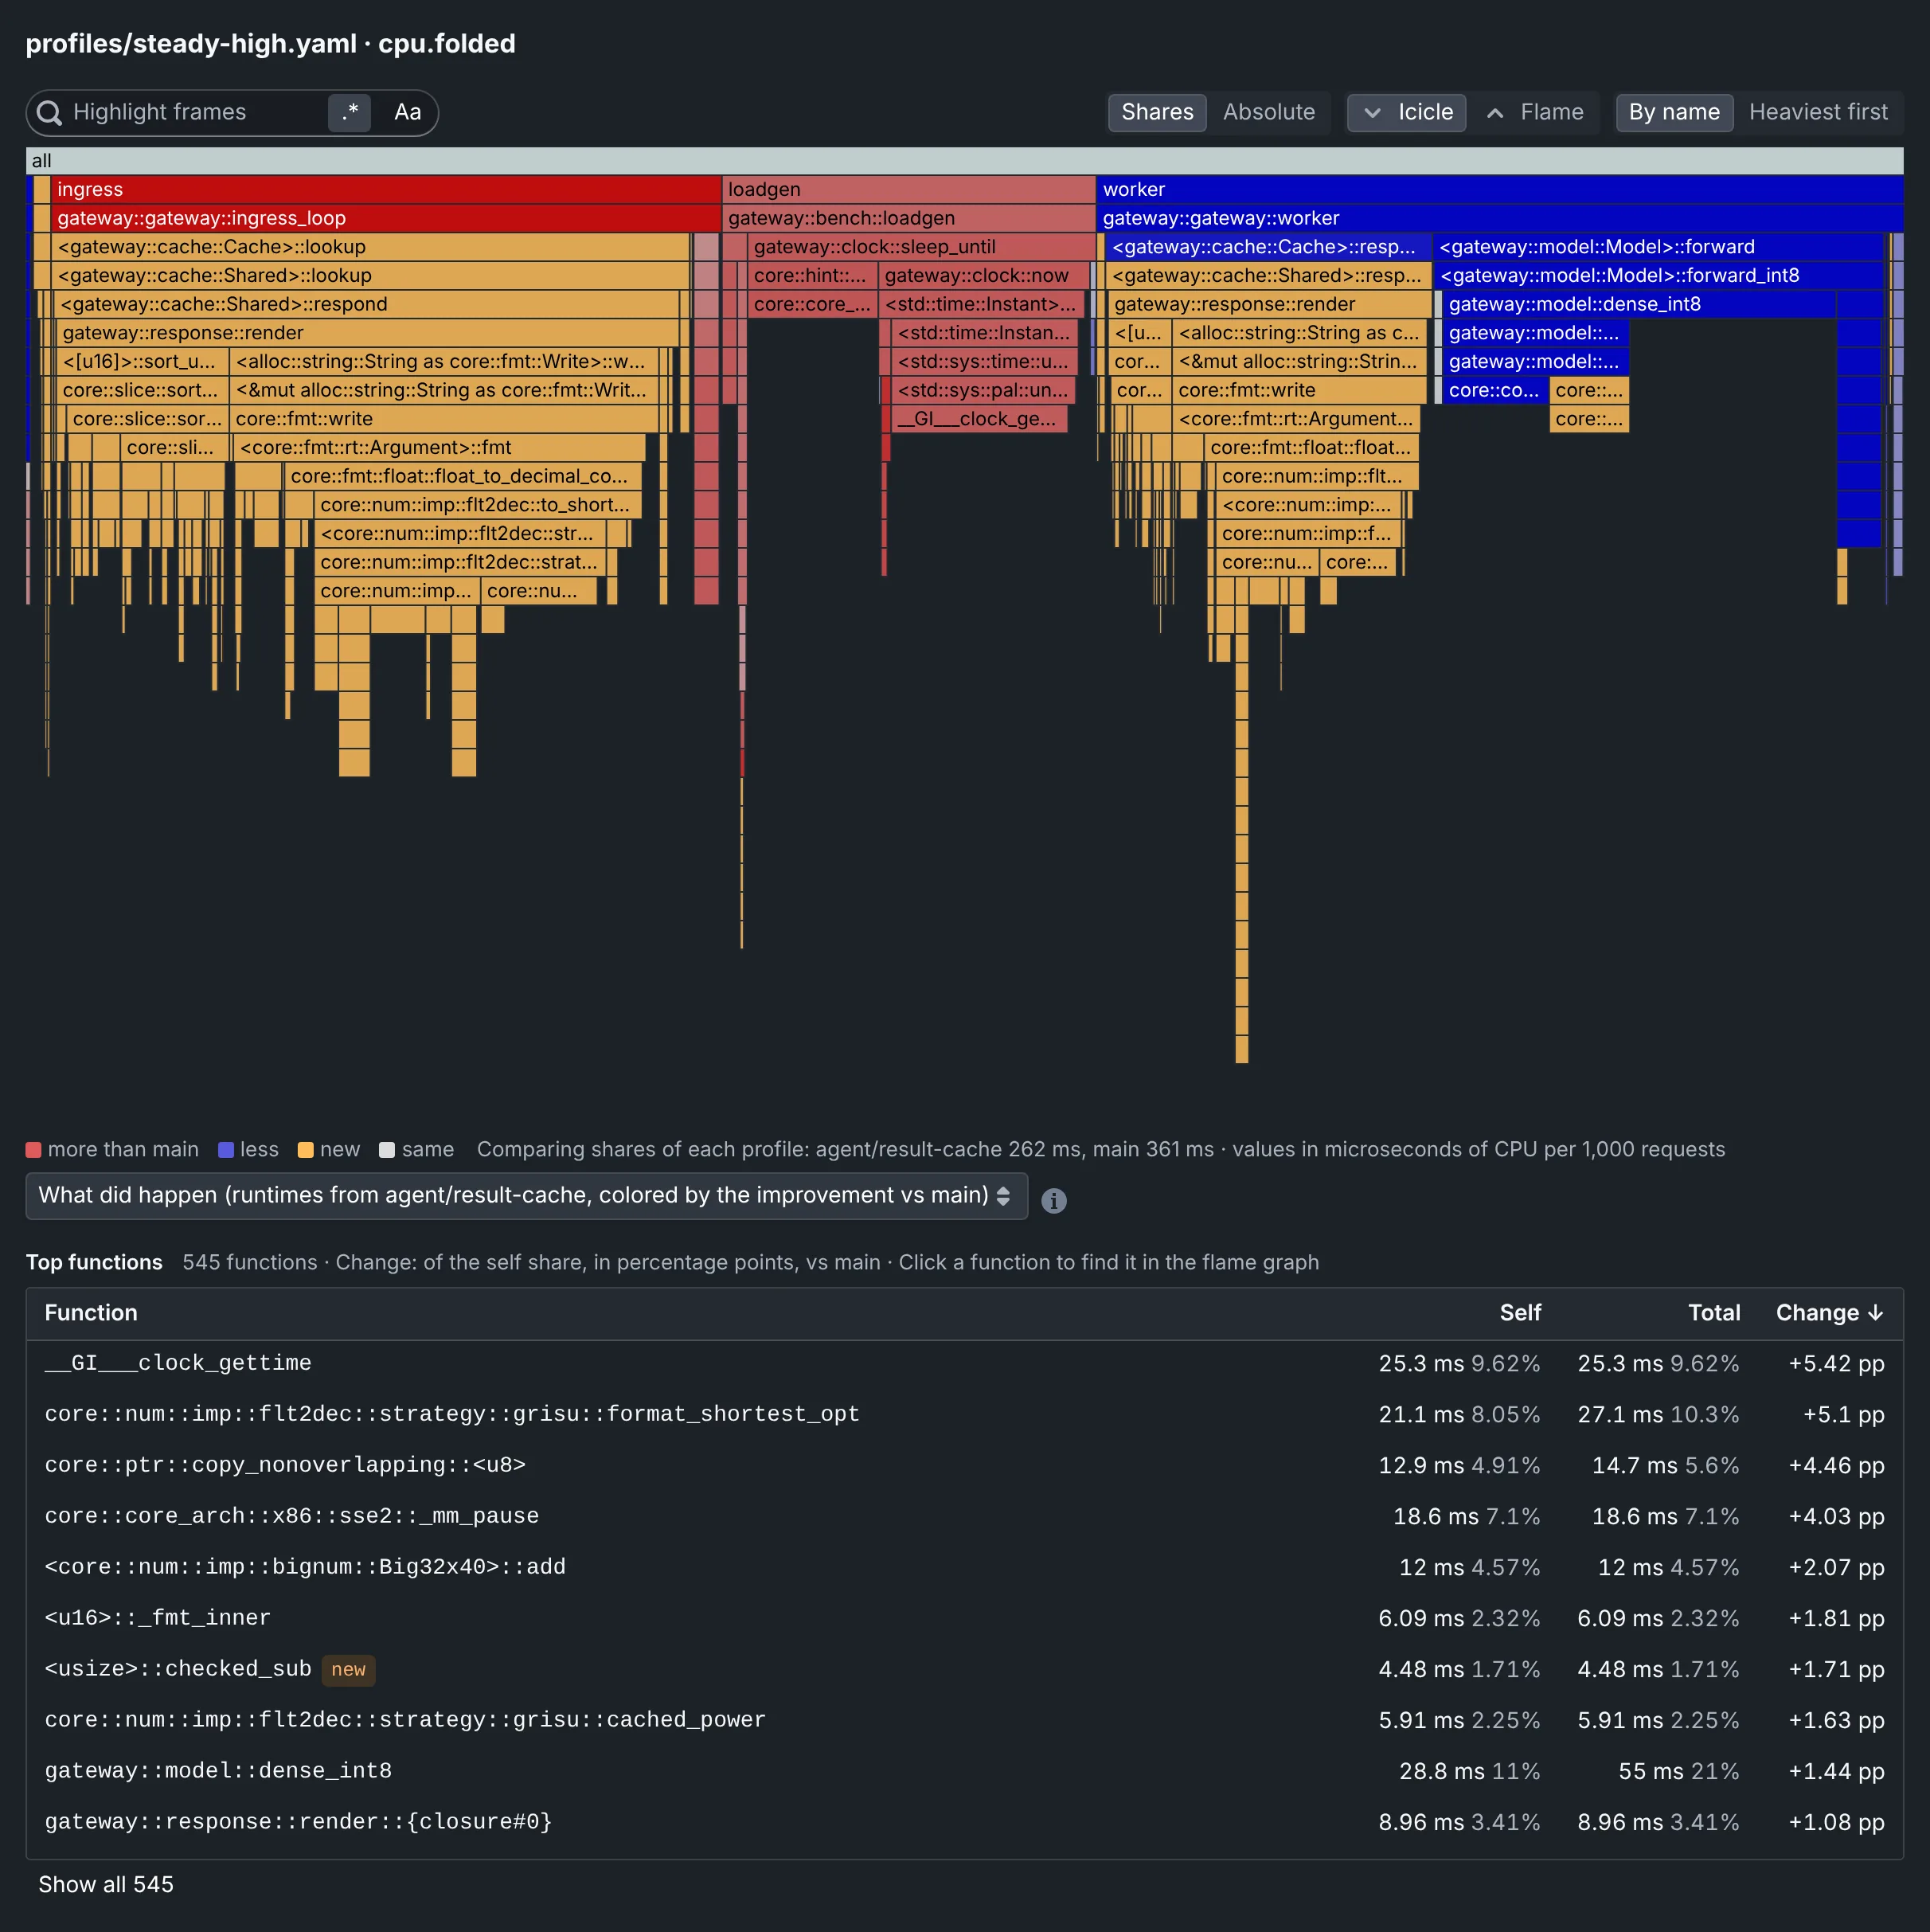
Show a profile next to the reference's
When a job already records a profile, qa upload cpu.folded saves it as a run, and the run's card shows the flame
graph: see Upload results from any tool. The steps below are for profiles recorded in the
runs of a batch.
With py-spy, for Python code:
-
Record the profile in
run(), into the run's output directory:qa/main.pyimport subprocessdef run(context):subprocess.run(['py-spy', 'record', '--format', 'raw', '--nolineno', '-o', context.output_dir / 'cpu.folded','--', 'python', 'my_script.py', context.input_path], check=True) -
Show the file in the run cards:
qaboard.yamloutputs:visualizations:- name: CPU flame graphpath: cpu.folded -
Run a batch on this commit and on the reference.
How people read the flame graph, search it and compare shares or absolute values is in the user guide: Flame graphs.
Record a profile with your profiler
qaboard.flamegraphs.save_flame_graph(path, source) saves a profile as folded stacks, from perf script's output, a
pprof file (.pb.gz), folded stacks, or a {"outer;...;inner": value} dict your code collected. It returns the stacks,
so profile.share("lock") can be a metric. With total=, values are rescaled to add up to it; unit= says what they
are.
- perf (C, C++, Rust...)
- py-spy (Python)
- async-profiler (JVM)
- Go pprof
- Node.js
import subprocess
from qaboard.flamegraphs import save_flame_graph
def run(context):
perf_data = context.output_dir / 'perf.data'
subprocess.run(['perf', 'record', '-F', '99', '-g', '-o', perf_data, '--', './my-binary', context.input_path], check=True)
script = subprocess.run(['perf', 'script', '-i', perf_data], check=True, capture_output=True).stdout
save_flame_graph(context.output_dir / 'cpu.folded', script)
perf_data.unlink()
Like stackcollapse-perf.pl: the command's name first, offsets and C++ arguments removed, unknown functions shown as
their module ([libc.so.6]). pid=True, tid=True and annotate=True (_[k] after kernel frames) are options.
import subprocess

def run(context):
  subprocess.run(['py-spy', 'record', '--format', 'raw', '--nolineno', '-o', context.output_dir / 'cpu.folded',
                  '--', 'python', 'my_script.py', context.input_path], check=True)
--format speedscope -o cpu.speedscope.json works too: the viewer merges the threads, and lets people pick one.
asprof -d 30 -e cpu -o collapsed -f <output_dir>/cpu.collapsed <pid>
<output_dir> is the run's output directory (context.output_dir), <pid> the JVM's process id. For allocations,
-e alloc and unit: bytes on the visualization.
import subprocess
from qaboard.flamegraphs import save_flame_graph
def run(context):
profile = context.output_dir / 'cpu.pb.gz'
subprocess.run(['go', 'test', './...', '-run', 'TestLoad', '-cpuprofile', profile], check=True)
save_flame_graph(context.output_dir / 'cpu.folded', profile) # in nanoseconds
Heap profiles: sample_type='alloc_space' (bytes) or 'inuse_space' (the default). The reader is a small decoder of
pprof's protobuf, with no dependency.
import subprocess
def run(context):
subprocess.run(['node', '--cpu-prof', '--cpu-prof-dir', context.output_dir, '--cpu-prof-name', 'cpu.cpuprofile',
'server.js', context.input_path], check=True)
Files the viewer reads
Save what profilers write in the run's output directory, as it is. The viewer reads the file's content; the name tells QA-Board to use it:
| Format | File names | Written by |
|---|---|---|
Folded stacks, main;parse;read 12 per line | *.folded, *.collapsed, *.stacks.txt, gzipped too (.gz) | stackcollapse-*.pl, inferno, py-spy --format raw, async-profiler, qaboard.flamegraphs |
| speedscope JSON, sampled or evented | *.speedscope.json | py-spy --format speedscope, rbspy, speedscope's converters |
| Chrome/V8 CPU profile | *.cpuprofile | node --cpu-prof, Chrome DevTools |
A tree, {"name": "main", "value": 1200, "children": [...]}, value including the children's | *flame.json | d3-flame-graph, your code |
Other names need type: flame/folded (any flame/... type) on the visualization. perf script's text and pprof
files are too big or binary for the browser: save_flame_graph turns them into folded stacks
(recipes).
The viewer reads profiles up to 200 MB (after decompression), and draws the first 1,000 levels of a stack: the search and the table of functions count deeper frames too.
Get profiles you can compare
- Keep frame names stable between runs: the viewer matches frames by their path of names. No addresses, hashes,
thread or process ids:
py-spy --nolinenoleaves line numbers out, andperfstacks start with the command's name, without its pid. - Shares or absolute values. Two runs rarely take the same number of samples: by default the viewer compares each
function's share of its profile. To compare absolute values too, save values that compare across runs, e.g.
microseconds of CPU per 1,000 requests (
total=, see below). - The unit: a
# unit: nanosecondsline in folded stacks (other tools skip it), or the visualization'sunitoption, which wins over the file's. Units the viewer formats:samples(the default),nanoseconds,microseconds,milliseconds,seconds,bytes; any other word shows as is. Words after the unit describe it:microseconds of CPU per 1,000 requests. speedscope and .cpuprofile files say their unit themselves; theunitoption still wins.
outputs:
  visualizations:
    - name: CPU flame graph
      path: cpu.folded
- name: Allocations
path: heap.collapsed
unit: bytes # the values' unit
The serving latency example saves its profiler's folded stacks, and rescales them to
microseconds of CPU per 1,000 requests, in
qa/main.py:
save_flame_graph(output_dir / 'cpu.folded', output_dir / 'cpu.folded', unit='microseconds of CPU per 1,000 requests',
                 total=bench['profiled_cpu_s'] * 1e6 / bench['profiled_requests'] * 1000)
Where to go next
- User guideRead a differential flame graph
Colors, the top functions table, search, shares or absolute values.
- Benchmark suites
Each benchmark against the reference's, beyond noise or within it.
- Viewers and file formats
The files every other viewer reads, and their options.