Benchmark suites
Bring a benchmark suite you already have into QA-Board: your run() runs the harness and saves the file it writes.
The web app shows each benchmark next to the reference run's, with the change in %, the spread the harness measured,
and what got slower or faster beyond it. Each benchmark can be a metric too, followed in History and checked by the
quality gate.
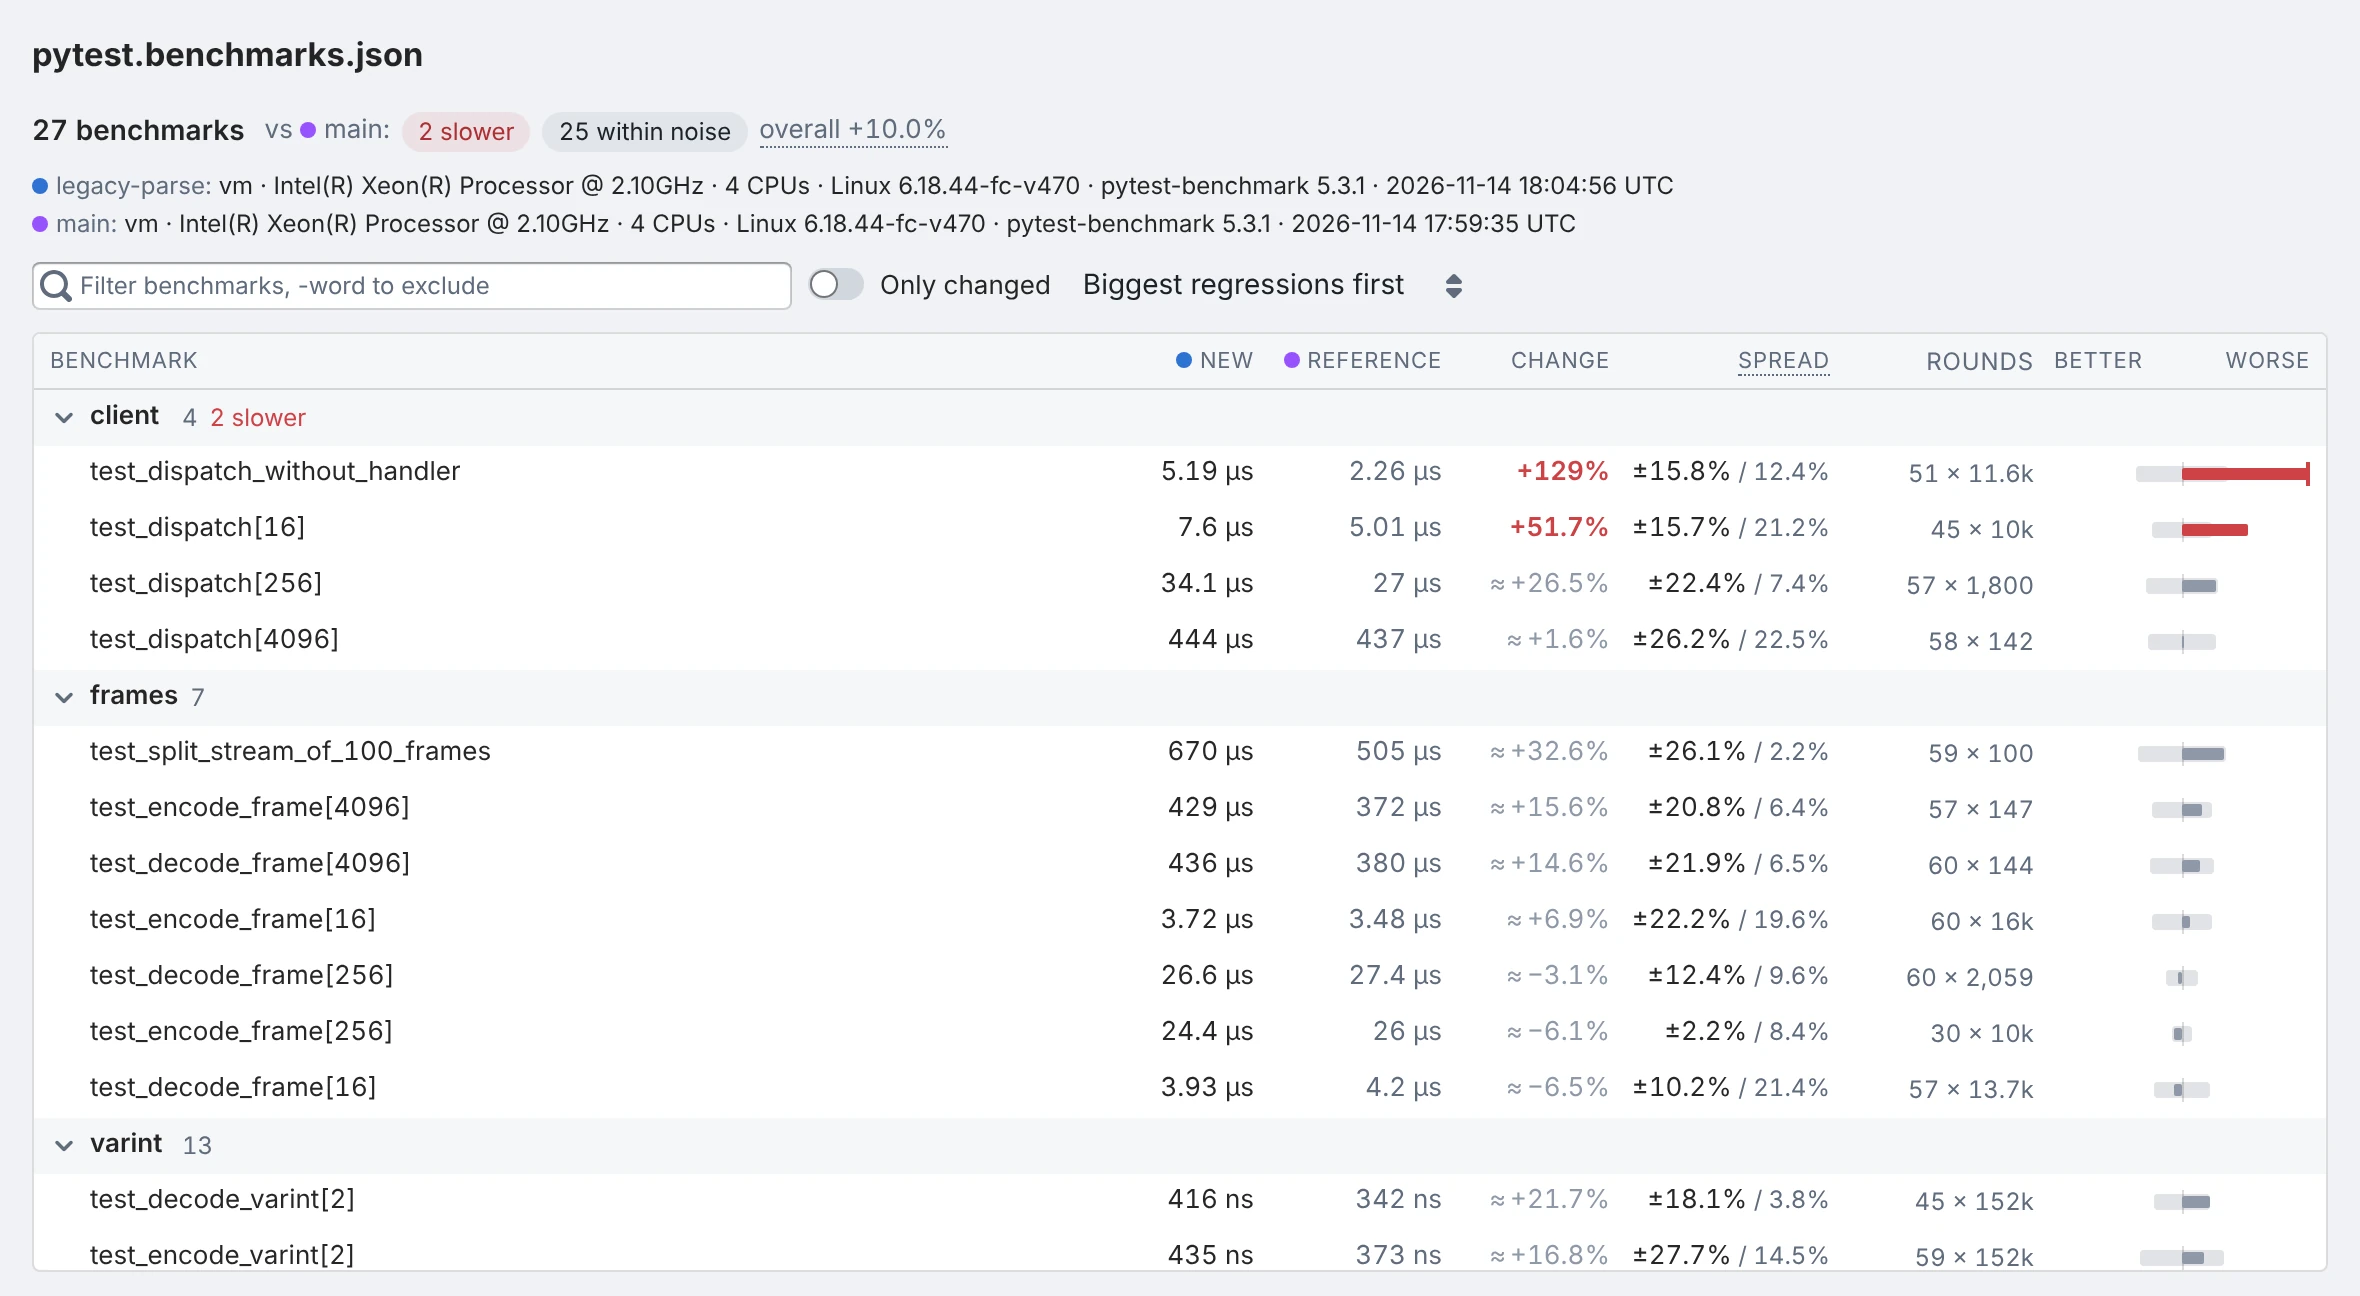
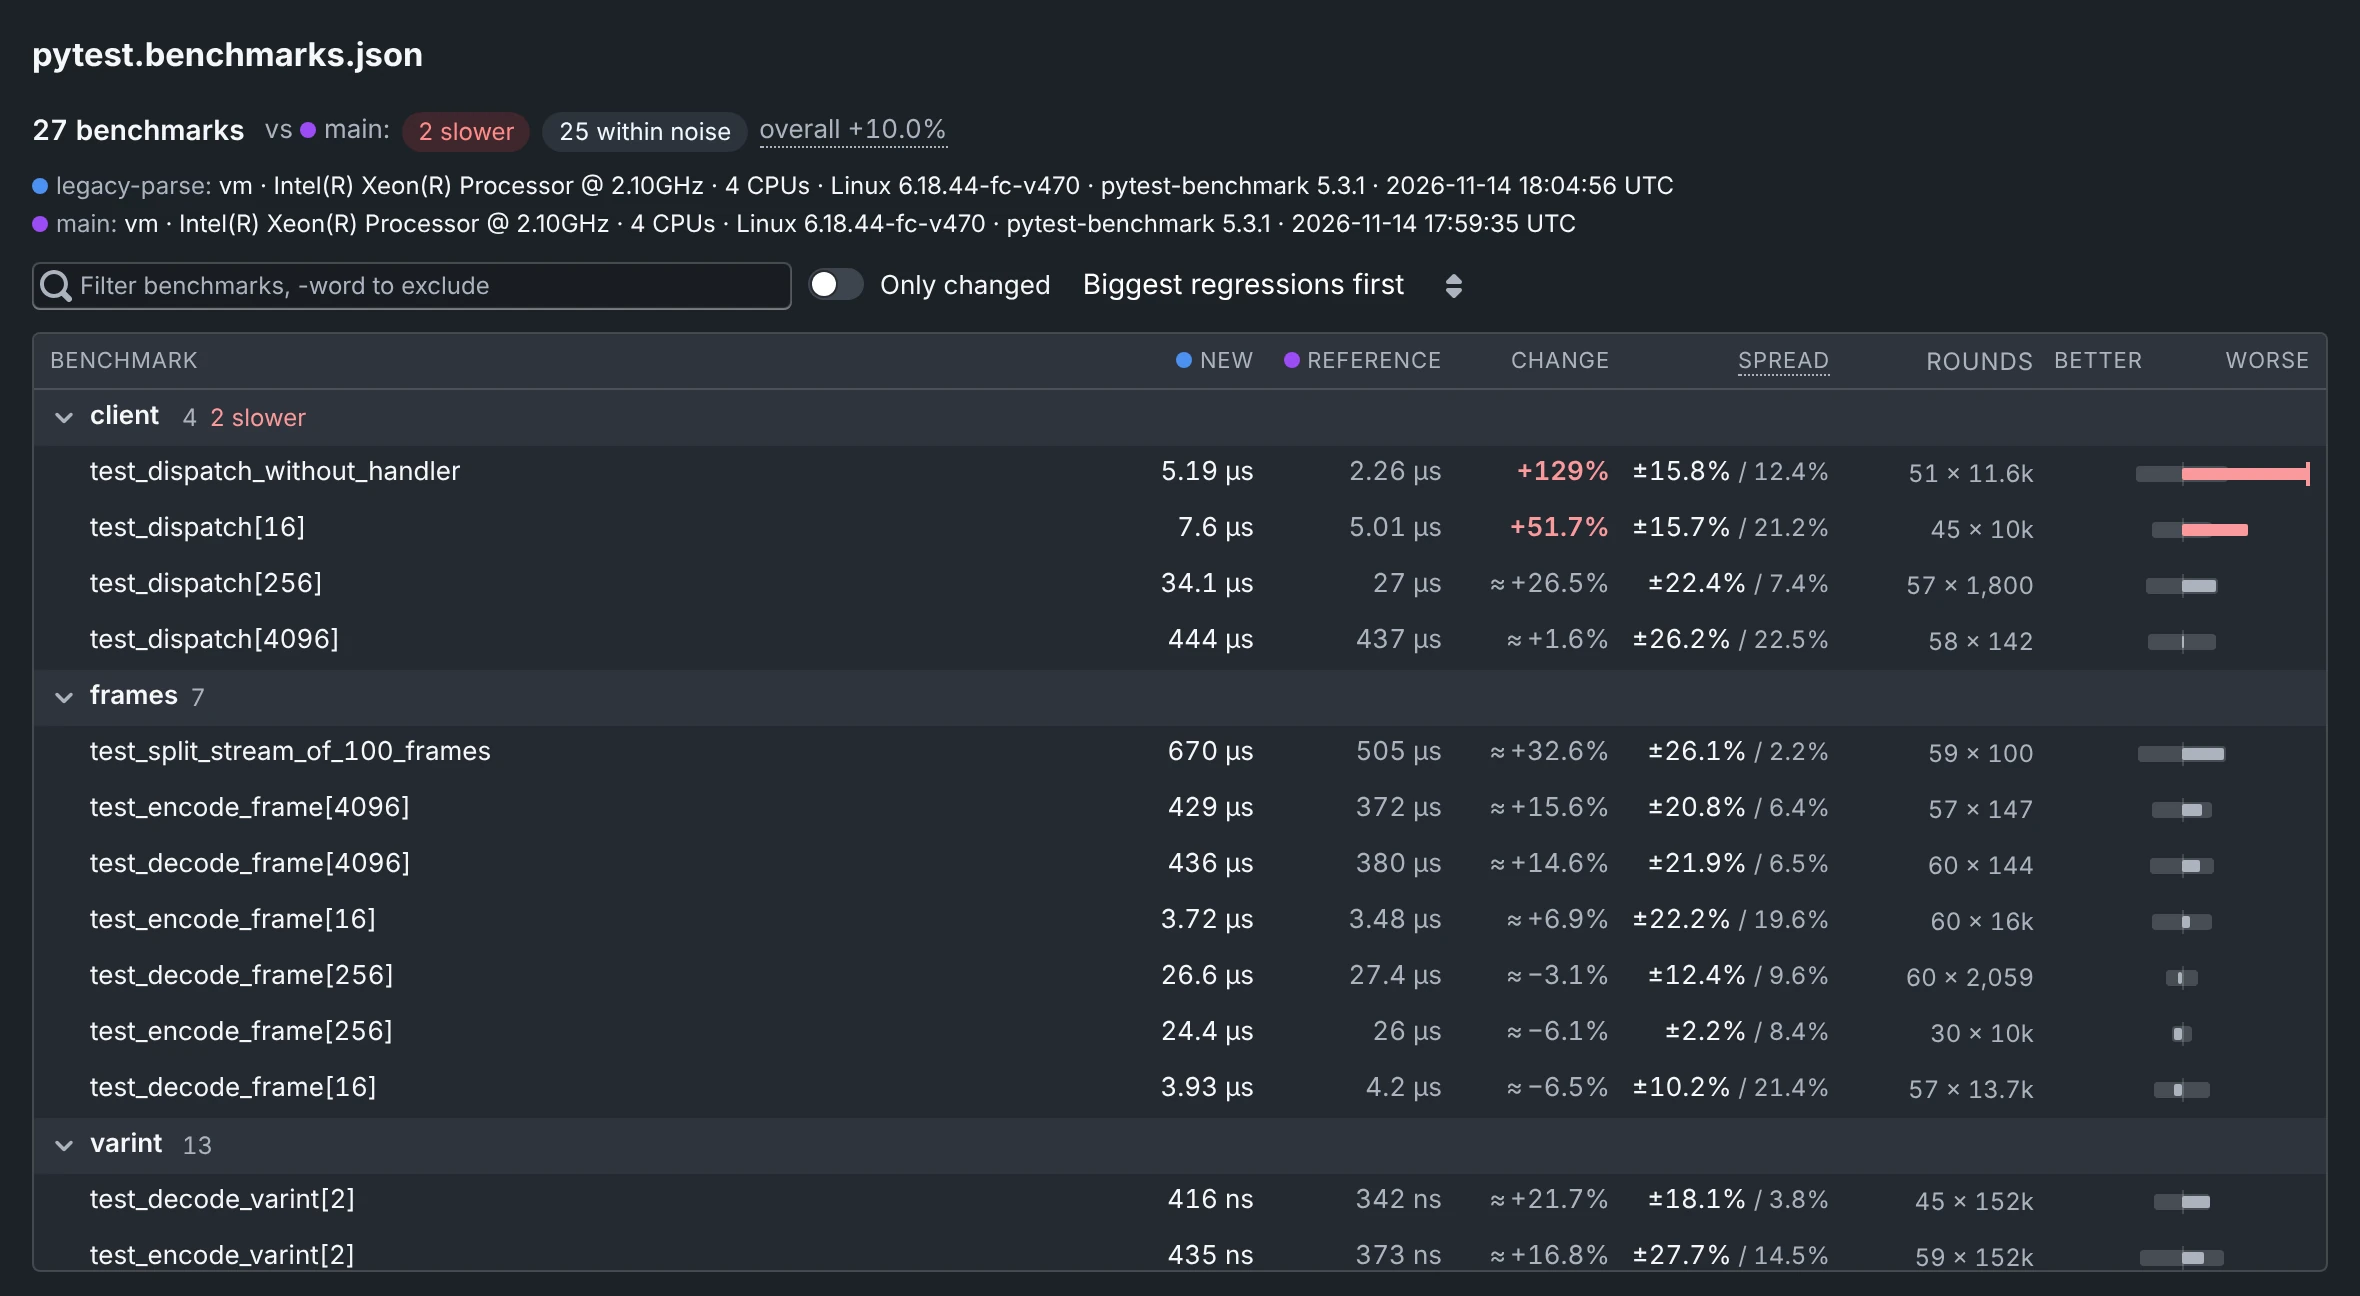
Show a suite's results next to the reference's
When a job already runs the harness, qa upload pytest.benchmarks.json saves its file as a run, with each benchmark
as a metric, and the run's card shows the table: see Upload results from any tool. The steps
below are for suites that QA-Board runs, on each input of a batch.
With pytest-benchmark:
-
Run the harness in
run(), save its file in the run's output directory, and return its benchmarks as metrics:qa/main.pyimport subprocessfrom qaboard.benchmarks import benchmark_metricsdef run(context):path = context.output_dir / "pytest.benchmarks.json"subprocess.run(["pytest", "benchmarks/", f"--benchmark-json={path}"], check=True)return benchmark_metrics(path) -
Show the file in the run cards:
qaboard.yamloutputs:visualizations:- name: Benchmarkspath: pytest.benchmarks.json -
Run a batch, e.g.
qa batch ci, on this commit and on the reference. One input per suite or per benchmark binary is enough.
The Visualizations view shows the table: how people read it is in the user guide, Benchmarks.
Harnesses QA-Board reads
The viewer and benchmark_metrics read these files as the harness writes them:
| Harness | Write its results with | Headline value |
|---|---|---|
| pytest-benchmark | pytest --benchmark-json=pytest.benchmarks.json | mean, ± stddev |
| Google Benchmark | ./bench --benchmark_out=gbench.benchmarks.json --benchmark_out_format=json | mean of the repetitions with --benchmark_repetitions, ± their stddev |
| hyperfine | hyperfine --export-json hyperfine.benchmarks.json '...' | mean, ± stddev |
| Criterion (Rust) | cargo criterion --message-format=json > criterion.benchmarks.jsonl | mean, ± median absolute deviation |
| JMH (Java) | java -jar benchmarks.jar -rf json -rff jmh.benchmarks.json | score, ± its error |
go test | go test -bench=. -count=5 > bench.txt (with type: benchmarks) | mean of the -count lines, ± their stddev |
| Anything else | write_benchmarks() from Python, or JSON in QA-Board's format | yours |
The file's name tells the web app to use the benchmark viewer: benchmarks.json, *.benchmarks.json,
*-bench.json, *_benchmark.json, and the same names in .jsonl. A file with one of those names that isn't a
benchmark file is shown as text, with a line that says why. Other names (a bare bench.json too) need
type: benchmarks:
outputs:
  visualizations:
    - name: Go benchmarks
      path: bench.txt
      type: benchmarks   # benchmarks/go forces the format
      height: 440        # the table's height, in pixels
Get numbers you can compare
QA-Board doesn't run, repeat or stabilize benchmarks: the numbers and their spread are those of the file. A change smaller than the spread shows as within noise, so a harness that measures once makes every change count.
- Repeat measurements in the harness: pytest-benchmark's rounds, Google Benchmark's
--benchmark_repetitions, hyperfine's--runs,go test -count. - Warm up and pin: the harness's warm-up options, pinned CPUs, no other load on the machine.
- Run the new and the reference commits on the same machines, e.g. a dedicated runner. The viewer warns when the two files say they come from different CPUs or CPU counts.
Each benchmark as a metric
benchmark_metrics turns the file into metrics, one per benchmark, to return from run(). They show in the
Metrics Diff and History, and the quality gate can check them. With a compiled Google Benchmark harness:
import subprocess
from qaboard.benchmarks import benchmark_metrics

def run(context):
    path = context.output_dir / "gbench.benchmarks.json"
    subprocess.run([
        "build/bench/codec_bench", "--benchmark_repetitions=10",
        f"--benchmark_out={path}", "--benchmark_out_format=json",
    ], check=True)
    return benchmark_metrics(path, prefix="codec_")
- Keys are the benchmarks' names in snake_case, like
codec_bm_encode_64ortests_test_codec_py_test_encode_64: keep names stable across commits.prefix=tells suites apart. - Values are in seconds, shown in the suite's typical unit (
µs,ms...), withsmaller_is_better=True. JMH throughputs are in operations per second, larger is better.unit="ms"picks the unit shown. statistic="median"returns another statistic from the file; benchmarks without it are left out.
A gate rule like {metric: codec_bm_encode_64, max_regression: 5%} compares the values,
not their noise: set limits larger than the spread your harness reports, or the gate fails on noise.
Other harnesses, and Criterion's directory
write_benchmarks writes QA-Board's format, *.benchmarks.json, that the viewer reads: from benchmarks you read with
read_benchmarks, or from dicts. Criterion's target/criterion directory has one file per benchmark, so convert it:
from qaboard.benchmarks import read_benchmarks, write_benchmarks, benchmark_metrics

def run(context):
    # --snip-- run cargo bench
    benchmarks = read_benchmarks("target/criterion")   # or any file above: the format is detected
    write_benchmarks(context.output_dir / "criterion.benchmarks.json", benchmarks)
    return benchmark_metrics(benchmarks)
Your own harness, with times in ns, us, ms or s:
write_benchmarks(context.output_dir / "tiles.benchmarks.json", [
    {"name": "render/tile_256", "group": "render", "value": 4.21, "unit": "ms",
     "stats": {"stddev": 0.12, "rounds": 30}},
], context={"cpu": "AMD EPYC 7763", "cpu_count": 8})
The format, and how files are read
{
  "$schema": "https://samsung.github.io/qaboard/benchmarks.schema.json",
  "qaboard_benchmarks": 1,
  "source": "kitefin-bench 2.3",
  "context": {"machine": "ci-runner-07", "cpu": "AMD EPYC 7763 64-Core Processor", "cpu_count": 8, "date": "2026-11-02T09:40:00Z"},
  "benchmarks": [
    {"name": "render/tile_256", "group": "render", "params": {"tile": 256}, "value": 4.21, "unit": "ms",
     "statistic": "median", "stats": {"median": 4.21, "iqr": 0.12, "rounds": 30}},
    {"name": "ingest/messages", "value": 182000, "unit": "msg/s", "smaller_is_better": false, "stats": {"stddev": 2100}}
  ]
}
nameandvalueare required. Times inns,us,msorsare converted to seconds; other units are shown as they are. Setsmaller_is_better: falsefor throughputs.statscan holdmean,median,stddev,min,max,iqr,mad(median absolute deviation),error(half a confidence interval),rounds,iterations,samples,ops,cpu_time,bytes_per_op,allocs_per_op. The spread isstddev, elseiqr,madorerror.- The JSON schema checks the file in your editor.
- Formats are detected from the content, not the name:
read_benchmarks(path, format="hyperfine")andtype: benchmarks/hyperfineforce one (pytest-benchmark,google-benchmark,hyperfine,criterion,jmh,go,qaboard). - Names: pytest-benchmark's
fullname, Google Benchmark's run name (its family is the group,name:valuearguments are parameters), hyperfine's command or--command-name, Criterion's id, JMH's benchmark with its parameters, Go's package and benchmark. A name seen twice gets#2. - Google Benchmark: the
mean,medianandstddevaggregates when there are repetitions, the real time otherwise;BigO,RMSand benchmarks that report an error are skipped.bytes_per_secondoritems_per_secondis the throughput. - Context: the machine, CPU, CPU count, OS, date and harness version, as far as the file says. Google Benchmark and hyperfine don't name the CPU.
- The web app and the
qaboardpackage read the same formats the same way: they are tested on the same files. - The web app reads files up to 100 MB, and says so for larger ones.
Where to go next
- User guideRead the benchmark table
Slower, faster, within noise: what reviewers see, and how they filter and sort.
- Profiles and flame graphs
See where the time went, against the reference's profile.
- Quality gate
Fail the CI when a benchmark gets slower than you allow.