Table of contents
| Introduction | What is CAS system |
| Build Awareness Service (BAS) | Creating build information database |
| BAS examples | Real-life usage of the build database |
| Function/Type Database (FTDB) | Creating code information database |
| FTDB examples | Real-life usage of the code database |
| Advanced automated testing techniques | Advanced systems leveraging the code database |
| Summary | Final conclusions |
| References | Click here for more information |
Introduction
Code Aware Services (CAS) is a set of tools for extracting information from the build process and the source code. This includes data such as how a particular software image is created or information on functions, types and dependencies across them. CAS makes this data easily accessible to external applications.

Figure 1. High level overview of the CAS system
It is composed of two parts. The first part is called Build Awareness Service (BAS) and it is a system which provides detailed information acquired during the full build of a product. The second part is called Function/Type Database (FTDB) which provides code information extracted from the original source files of the product build.
The architecture of the CAS system is described in the following picture.

Figure 2. Code Aware Services (CAS) system architecture
The Build Awareness Service (BAS) extracts build information during the full build of the product (therefore the full build needs to be done at least once). Code database is created by specialized code processor that extracts code related information from the original source files using specific build configuration provided by BAS.
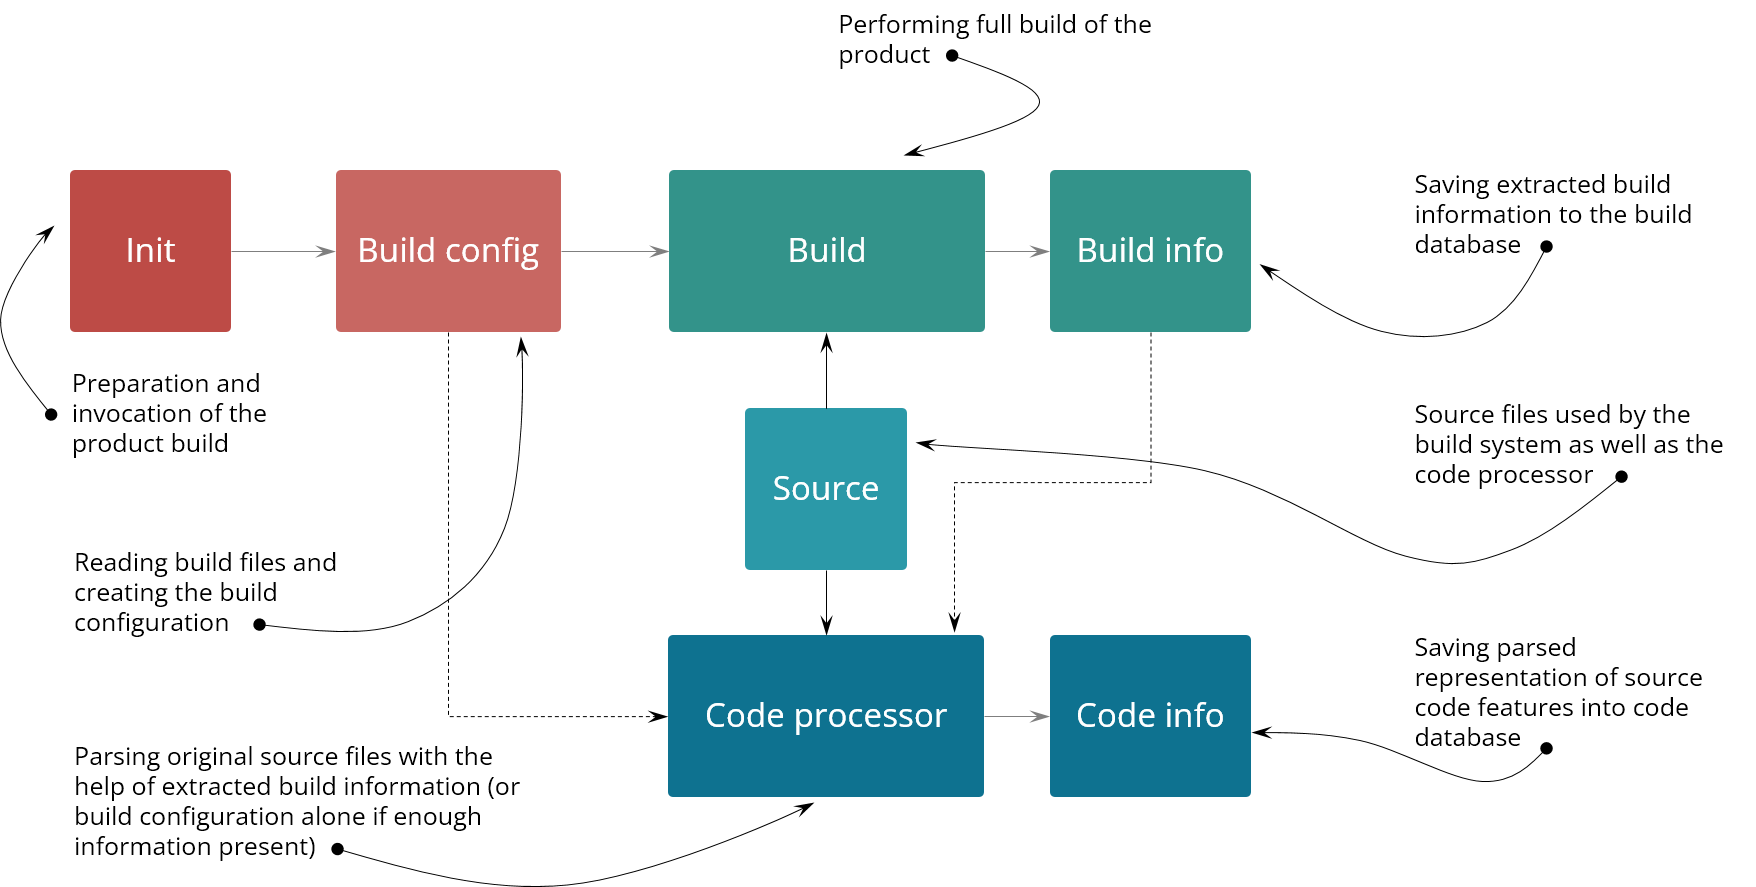
Figure 3. Detailed explanation of the CAS system architecture
CAS can help in implementing some of the Developer Productivity Engineering (DPE) concepts for the large, complex low-level system products. The main DPE concepts are: (1) reducing the feedback cycles of the development process, and (2) providing insight into the build process through instrumentation technology and data collection. We believe that two additional concepts could be added to the core DPE list: (3) tools that boost the productivity of developers working with the code, as well as (4) tools for automation of test execution and issue detection. Let's now delve into more details regarding the CAS project and how it can be used to implement some of the DPE concepts for a wide range of large, complex low-level system products.
Build Awareness Service (BAS)
Ok, so what kind of problem are we facing here? Imagine you do a development of a large, complex S/W system. It might be a mobile phone, it might be an operating system in your car, it might be a game engine, etc. Now imagine you need to learn how the product is built, the structure of the S/W, what parts it consists, etc. This is exactly what you would need to do if your task required you to operate on the product code that you've never seen before (e.g. performing general source code review of the system code looking for issues). Now the problem is that the complexity of today’s S/W systems is extremely large. As we already mentioned it's easy to download millions of files from the repository to build a decent product in the recent times. Even if we focus on the low-level native part of the product (i.e. C/C++ files) where the most of the memory corruptions problems originate, we still have to handle a multitude of source files in the range of hundreds of thousands (spanned across a few thousand linked modules, i.e. libraries and executables).
Another problem is that you can build many distinct products from one source tree (or variations of a single product). That means only a subset of files is actually used to build one specific configuration of a product. And the final complication is that you have preprocessor definitions which are used for conditional inclusion of code within the source files. That means different parts of one source file can be used for two different build variants. How could you know if the code you're looking at is even running? Let's take a look at the below source code. Would you be able to quickly decide which source clause would be actually compiled at this point?
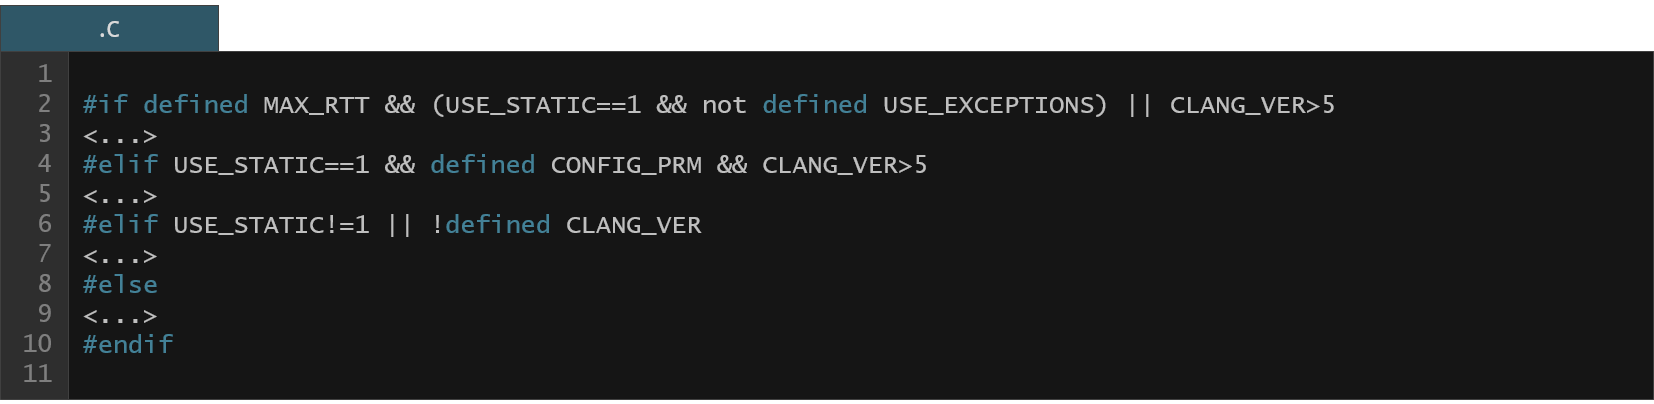
So how could you know which parts of the source code are actually used in a given configuration? Well, the build process is able to create the final image file that you can download, flash on your phone and it even works! That means all the information is located in the build process itself. What kind of information is that?
- Which sources are compiled,
- Exactly how they are compiled,
- Dependencies between built files,
- Information about custom tools executed during the build (it turns out that some tools can actually create some of the source files, e.g. auto-generated header files).
In that case all we need to do is just to track the build and grab all the configuration information that we want.
Implementing the build tracer is not an easy task. First we need to decide what we need to trace. It seems enough to trace all the files opened during the build (open family of syscalls) and all the commands executed during the build (execve family of syscalls). It also helps to track pipe syscalls to catch which processes exchange information between each other using pipes. But how to implement the tracer? We've considered various approaches. There's the LD_PRELOAD trick that allows you to hook in your own implementation of selected syscalls (this is how the Bear [1] tool works to intercept execve syscalls). The problem is that it works only for dynamically linked executables. Furthermore, the traced build system can use the LD_PRELOAD trick for its own purposes which could interfere with the tracing capability.
Another approach would be to use ptrace system call (the core syscall used by the strace Linux utility for tracing syscalls). This had actually worked fine for a very long time for us until we moved our builds to very fast servers with 128 execution threads. At this point it finally broke (the overhead rose dramatically). This could be due to some inherent synchronization issues of the ptrace system call when executed concurrently across many distinct processors. There's eBPF which seemed promising but at the time of investigation it haven't had the required capabilities to perform the full trace of required syscalls (the kernel's eBPF API was insufficient, and the instructions count limit imposed on eBPF programs, together with control flow restrictions, made it infeasible to implement more complex tracing logic). The eBPF approach still needs some revision in the future as its capabilities to run the code safely in the kernel context would allow us to write the tracer to track the syscalls on demand without modification of the running system. Finally, we have implemented the tracer as a Linux kernel module to track required information inside the kernel and write the data to the Linux kernel tracing infrastructure buffers. As for the overhead, it highly depends on what the build system does exactly, but on average for full Android Open Source project build we had around 5% overhead in the build time.
Below you can see the BAS architecture. It’s quite simple and straightforward. The tracer tracks the build and saves raw syscall information to a file. It's then post-processed and saved in a JSON file which can be easily accessed by applications (it can be also stored in a proper database). Two additional remarks regarding the architecture are as follows. Some executed processes during the build have special meaning (e.g. the compilation commands). These are analyzed further to extract additional data from it (like preprocessor definitions defined on the command line or include paths used by the compiler, etc.). There is also functionality to compute file dependencies between built files, so for example we can compute a detailed list of files that the Linux linked kernel executable (vmlinux) file depends on (which is a list of files which were actually used (i.e. exact sources, headers, etc.) to build the vmlinux).
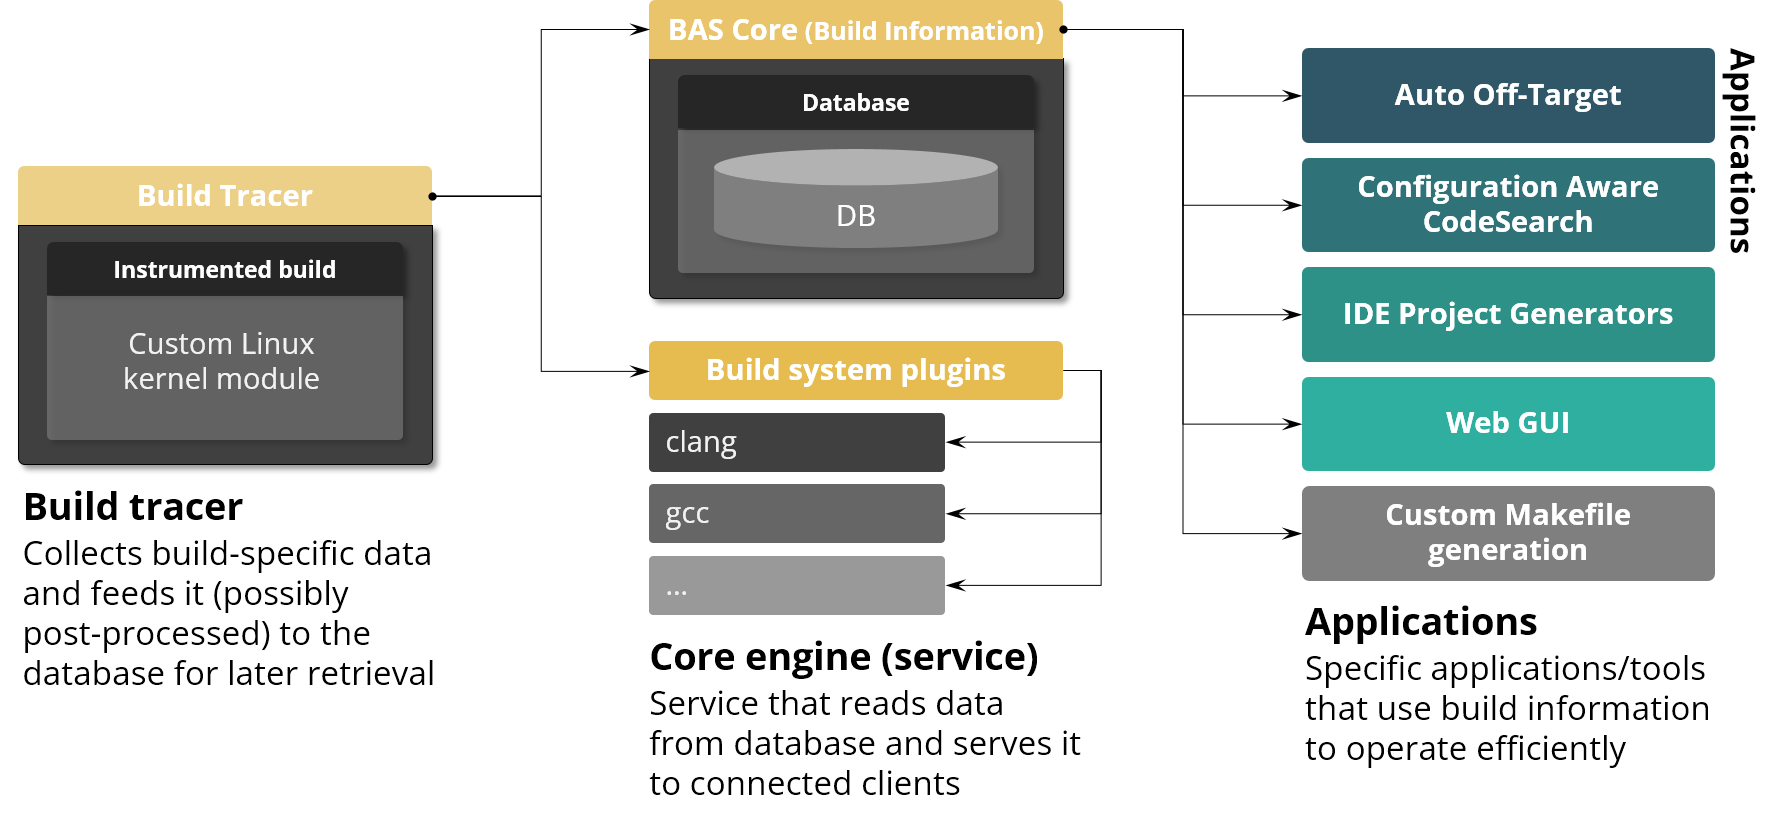
Figure 4. Build Awareness Service (BAS) architecture
BAS examples
Let's now see how the BAS can help in the developer productivity area while working with large S/W system code.
[Code search improvements]
BAS can improve working with code by narrowing the code base, so both manual inspection and code search utilities may greatly benefit from it. Due to the fact that BAS has information of every file opened during the build we can easily get the exact subset of files that were used to create the final product or any of its part. As you can see in the example below – the full Android AOSP tree consists of more than 1M files – but, after building the product we found that only 166k of files were involved in the build process. This subset is even smaller in case of a common kernel tree where 8k out of 98k files were used during build.
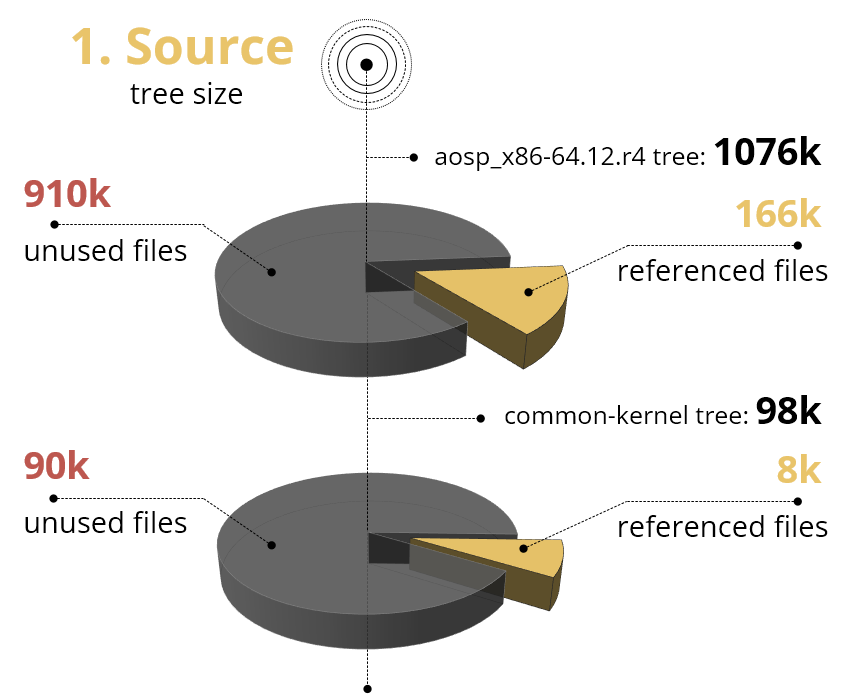
Figure 5. Comparison of full source repository size vs relevant files size for the AOSP emulator build
Similar results can be observed – in the second example below – when searching for a specific keyword. The 'GPU' phrase was found around 200 times in relevant files which is only 9% of all 'GPU' keywords in full source set and in about 5% in common kernel tree. We can imagine that such a view of the minimal subset of source files – which may be about 10 times smaller – can be really useful when dealing with code search or using code analysis tools.

Figure 6. Comparison of code search performance for full repository size vs relevant files size for the AOSP emulator build
[IDE indexing improvements]
We all know that IDE can improve working with sources. Code completion, symbol references, support for defines and even macro expansion – all these features require proper code indexing. Imagine that we want to create a project in our IDE that includes only files that were used to build vmlinux kernel executable. With the help of BAS we can easily generate minimal source set of dependent files and feed them into the project structure. But opening this project in (for example) Eclipse CDT IDE may still result in many indexing errors – like missing include files, unknown symbols and others. Why does it happen? Because in order for an indexer to operate properly it needs exact compilation switches used during the build, especially it needs to grab preprocessor definitions passed to compiler through command line. JSON Compilation Database can really help with this problem. It is a file that contains commands with all arguments used to compile source files. Compilation database file format is supported by most IDEs with C indexing feature and can be easily generated by using the BAS. It is worth mentioning that BAS can also generate additional information – like internal compiler definitions that increase indexing precision even more. As a result of adding compilation information we get almost perfect indexing statistics (please see the table above), which translates into a much better code browsing experience.

Figure 7. Eclipse CDT indexing statistics for full Linux kernel source tree vs relevant tree with compilation information
[Process visualization]
Build systems are very complex software. I bet that every programmer stumbles on some build problem from time to time. When a build fails, having a process visualization can help navigating a hierarchy of the build commands, and makes it easier to trace back to the exact point where the error occurred. By using information about processes hierarchy BAS can be used to build a service, e.g. web application – that allows users to browse process tree and can assist in verifying that the right build commands, compiler flags, and options are applied consistently across all built items. We can also analyze build flow that provides step-by-step view of build sequence which may help resolve dependency problems. In the example below, at the top we see a simple makefile which compiles a single source file and produces an executable.


Figure 8. Process tree viewer for the simple example of a C application
[Execution time measurements]
BAS database contains a lot of information about traced processes – among them are process creation time, duration, average CPU utilization and list of events with CPU core association. Having such information allows us to create a timeline of CPU utilization of our build processes. Next we can check if there are any suspicious periods on our timeline – like time frames with very low CPU utilization. Inspecting the time frame will get information about all processes that have been running in a given period of time and information about which CPU was used to serve events of this process. We can spot for example some parallelization problems when most of the cores are idle, or long running tasks block build progression. Analyzing this information can lead to better understanding what happened during build and may give us clues about what might cause bottlenecks in our system.
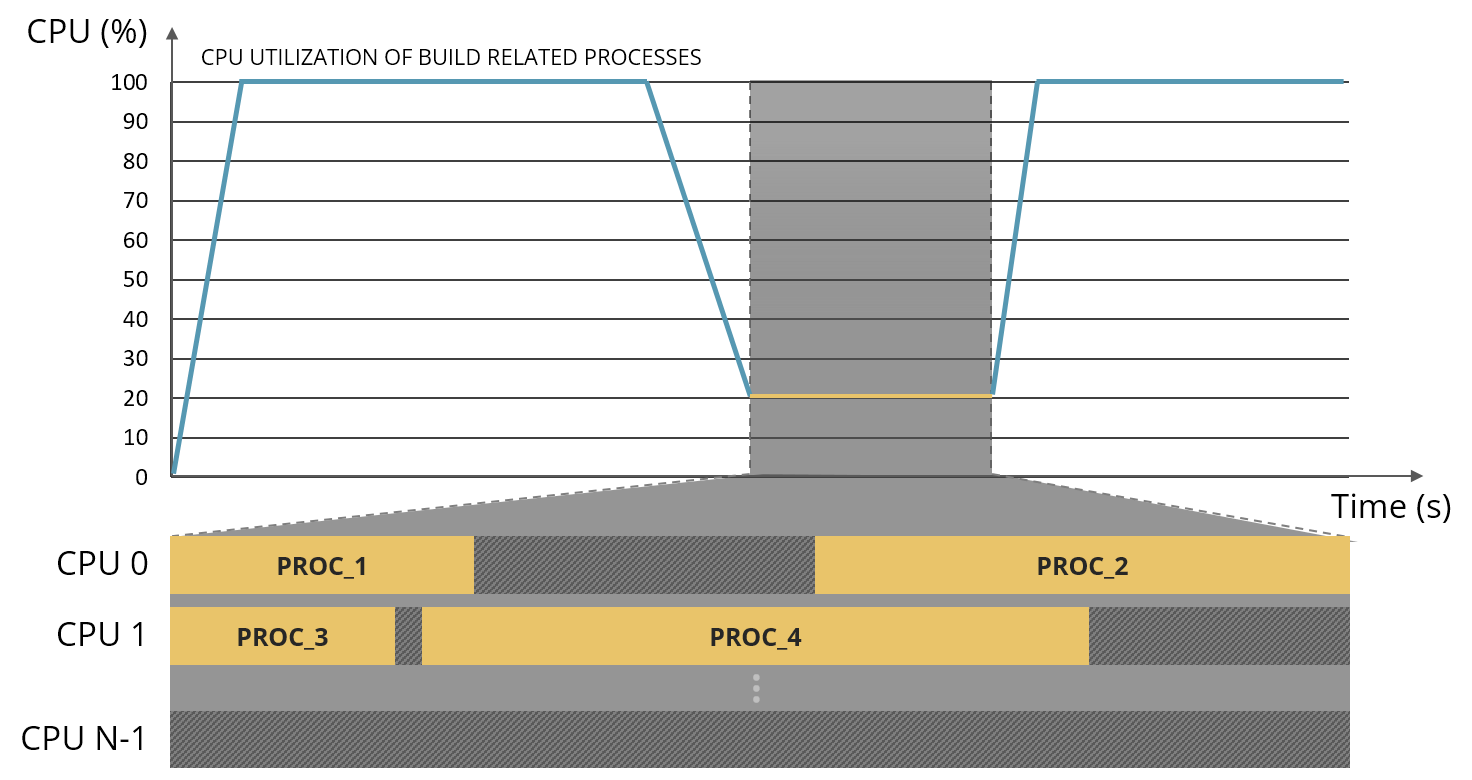
Figure 9. Example of timeline of the CPU utilization that can be derived from the BAS information
[Build dependency analysis]
Another example of how we can utilize BAS database is build dependency analysis. Thanks to the process call hierarchy and opened files information we can generate a file dependency tree of any file (and by file dependencies we mean a list of files that have been used directly or indirectly to create a given file). Implementing such dependency tree, e.g. in the form of web application, can help us understand relationships between different modules and files. This can aid us when dealing with issues in a complex build system. Consider the below exemplary dependency tree. We can see that some of the tree branches are linked modules that consist of other dependent modules and files. So if we change one of .cpp files, all parent branch nodes will be potentially affected and need to be rebuilt. Thanks to dependency analysis (as we will show in the next example) we can also implement custom build scripts, where only the necessary tasks are executed when source code changes. This can save time and resources by avoiding unnecessary recompilation or rebuilding.

Figure 10. Example of dependency tree viewer for the AOSP based build
[Custom build script generation]
Another example of using BAS can be utilizing process information to generate build like scripts. The first thing we have in mind when it comes to makefiles in general is compilation, and one of the most problematic aspects in a large software tree is build time. Luckily, incremental builds can save a lot of time and narrow compilation to small parts of code that were changed. But in huge projects even though incremental rebuild may be available, and if we bravely assume that they work flawlessly, the build system can takes a few minutes before actual compilation starts. Generating selective makefiles or build scripts for desired subset of source files allows replaying build of files and its dependencies without running the whole build system. Of course this is only the case when build configuration did not change. Such selective build scripts can greatly shorten development build-to-test cycles.
One more usage of BAS might be helping various tools like static analyzers, linters and checkers that use original makefiles to perform their job. For example, in order to perform static analysis of the C/C++ code using the Clang static analyzer, we have to run the original build under the scan-build tool. It should then detect all the compilations executed during the original build and will perform static analysis of each originally compiled source (instead of compiling them). The problem may arise when you have a very large build but you want to perform selective static analysis of certain files only. Generating simple makefiles with selected compilations can facilitate the fine-grained static analysis only on the files that we actually need or care of.
We can also use makefile generation to prepare scripts that do all sorts of generic work. Imagine that you want to execute a custom plugin with every invocation of the javac compiler over a set of .java source files. You could extract a list of java compilations and prepare them for injecting the javac compiler plugin by using prefix or postfix in a custom makefile like in the example presented below.

Figure 11. Example of Makefile that injects additional commands into the javac invocation
Finally, we can use custom build script generation for quick verification of potential build failures. Imagine that you've changed a single source file and want to verify if the build completes successfully. If the build is large and incremental build feature is not available, this might take quite a long time to finish. Now if along the source modification a simple error was introduced (e.g. missing closing '}' in a C source file), this might be notified very late in the build process (and the entire time of proceeding build would be wasted). With the help of BAS we could generate simple build script that would check which source files were modified compared to some predefined release version and try to compile only changed files based on the base configuration. In that case build verification failures (i.e. introduced by the programmer) would be quickly detected and simple to resolve.
[BAS command line tool]
By looking at previous examples some of you may wonder – how to get all this information about compilers, files, dependencies, IDE projects and makefiles? CAS repository contains a command line tool designed to process trace file into a database and query for all sorts of information. Using BAS command line is a simple concept. We run a client with command dependent on what we want to get in return, like linked modules, referenced files, dependencies, compilation info, then we add some parameters like filters, sorting or limiters and we get results. Command line includes a filtering engine that supports logical expressions, files and executable types, path matching and many more.
As you can see in the below example we use filter to get only existing files that are placed within the source root directory – this is in fact the easiest way to get the minimal source set described in one of previous BAS examples.

Figure 12. Getting the list of all used original source files during the build
Commands can be chained – it means that output from one command can be redirected as input to another command. We can see this in the below example – first we use the linked modules command with vmlinux and .ko filter, then we pass results to the dependencies command and add some arguments for IDE project generation. This is an example of how we can generate IDE project for kernel executable and all Linux kernel modules.

Figure 13. Generating project description files for Eclipse CDT for Linux kernel modules
In the last example we can see makefile generation of all commands using javac binary like in previous BAS example.

Figure 14. Generating custom Makefile with all java compiler invocations
[BAS web-API access]
But what can be even more useful than the command line? A nice web service. And BAS provides this as well. BAS web service shares the same code base as command line client, thanks to this both have the same functionality. And as we can see in below examples, even url queries are very similar to console commands.

Figure 15. Getting the list of all used original source files during the build

Figure 16. Generating project description files for Eclipse CDT for Linux kernel modules

Figure 17. Generating custom Makefile with all java compiler invocations
Web service gives us freedom of remote access which is essential when working in large infrastructure. Web access can also decentralize location of tools and services which utilize web API. For example, you can provide web service with access to the BAS database for every major S/W test release for a given product for the engineers to use during development phase. To summarize – both web service and command line client are simple to use yet powerful tools that can be used to query BAS trace database.
[BAS Python API]
But what if this is still not enough? You can take matters into your own hands and use programming API. Both command line client and web service are built on top of libetrace library. It is a highly optimized C-based library intended to be used within the Python code. It contains database engine and set of functions for data query, dependency generation and filtering. Repository contains python interface file so IDEs will assist you with code hints and documentation. Usage is simple – with just a few lines we can initialize and load BAS trace database, and after that we are granted access to a variety of functions and objects for querying data about our traced build.
The following example gets kernel file path and iterates its file dependencies looking for header files related to dependent compiled files.
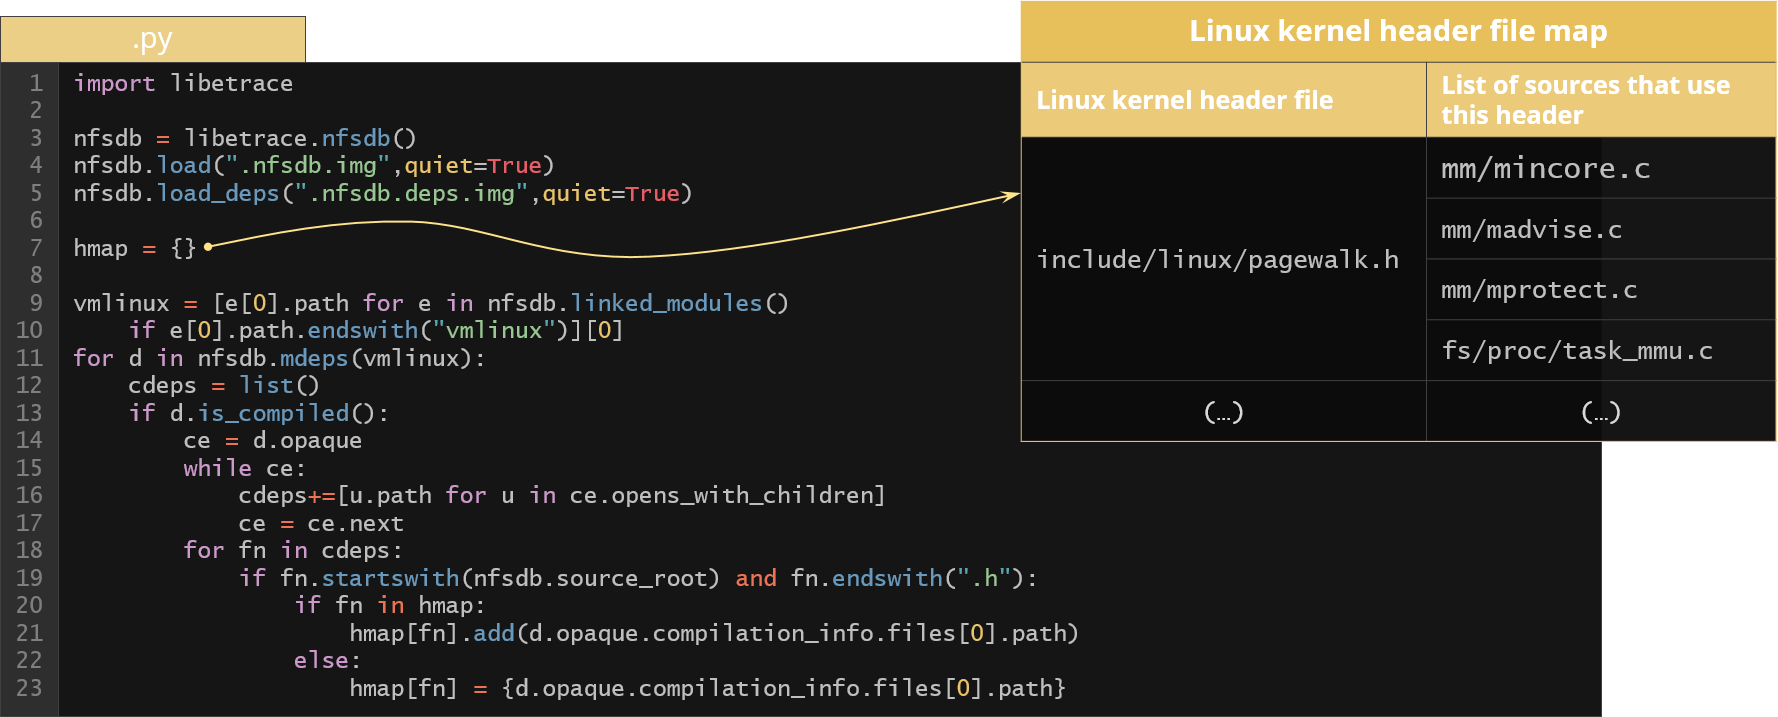
Figure 18. Example of using BAS Python API to generate Linux kernel header file map
As a result we get the map of every header file with a list of compiled files that somehow used this header file.
To summarize the Build Awareness Service (BAS) concept, it can be used to trace executable, process trace information to database, and query it for all sorts of data usages. In our examples we focused on build systems but BAS can be used in very generic scenarios. You can think of it as a generic Linux system utility. It therefore supports all build systems out of the box. The examples presented showed how it can help implementing some of the DPE concepts for the low-level complex S/W systems. And so code search or IDE indexing improvements let the developer focus on the relevant code for the product and generally improve his experience using the code related tools. Process or dependency visualization equipped with execution time measurements allows you to make insight into the details of the build process, solving build failures and providing data that could help speed up the build (and therefore improve the feedback cycles). Custom build script generation allows for replaying a very fine-grained parts of the build that allows for hooking in into the build internals, helps in quickly finding build verification failures and finally makes it possible for partial incremental builds of a very complex, multifaceted build systems. Various interfaces to the BAS database allows the end user to scrutinize the BAS data when needed but also allows for automation of various S/W related operations based on the build information from a given configuration.
Function/Type Database (FTDB)
Let's now focus on the second part of the CAS system called Function/Type Database (FTDB), the part which creates a database of source information extracted from original source files.
Now we have relevant code of the product perfectly indexed in an IDE. We know the structure of the code very well, we can finally start working with the code. Let's further imagine that our job is to make a source code review and find S/W problems in the code. How would you approach this problem? How would you find problems in the code? You would probably rely on your experience and try to find some erroneous patterns in the code. But the main problem is still there, we have a large amount of source code to review. For example, for the Linux kernel executable for the mobile product it's pretty common to face more than four thousand source files (translation units only) to handle. What we can do now is to try to employ some automatic testing techniques, like dynamic analysis, i.e. fuzzing or sanitizers. But how could we support/automate the source code review process itself?
There’s this idea: what if everyone that works with the code and have willingness and capabilities to do that could write their own tools that operate on the source code relatively easy in any language they want? So they could transform their own mechanism to detect erroneous patterns into more automated form that could also work at scale. In order for this task to be successful we would need an easy access to the parsed representation of the source code. So how could we parse the source code? Writing our own parser is not an option due to enormous complexity of the C (and especially the C++) grammar. But hey, there are working compilers out there so why don't we just use a parser from there?
As it turns out there is something that we could use straight away – the clang frontend for the llvm. The beautiful thing about clang is that it's just a collection of libraries that implements various parts of the compiler. So we can just take the parser library and create our own application that transforms the source code into its parsed representation. So what is the parsed representation? What does it look like? It's some sort of a tree, it’s called abstract syntax tree. In other words, it's just a code represented in a tree-like form (a tree of nodes). Each node in the tree is described as a C++ class that implements some specific functionality of the source grammar. Below is an example of a very simple code and its tree-like (AST) representation.

Figure 19. Example of a simple C++ code and its Abstract Syntax Tree (AST) representation
It's an equivalent representation, meaning the source code can be generated back from the AST form. Now this is a tree so it's easy to walk/traverse (of course we need to write custom C++ code that will traverse the tree and implement some high level operation on the corresponding nodes according to the specification). Now we have a problem: for each application that we want to write (e.g. some custom static analyzer) we need to write this C++ code that walks the tree and implements the required functionality. So how about we write the code once, we will walk the AST and extract some interesting data from the code and save it into some easily accessible intermediate format (like JSON file)?
This is exactly what the Function/Type Database (FTDB) is about. We have this clang based processor that parses the original source code, extracts some predefined features from it and saves it into the JSON file (which can be then stored into the “proper” database). So what do we extract from the source code? We grab information about functions, types, global variables and initializers for the function pointer members of the global structure types. Below you can see an example of a simple code and (part of) its representation in the JSON file.
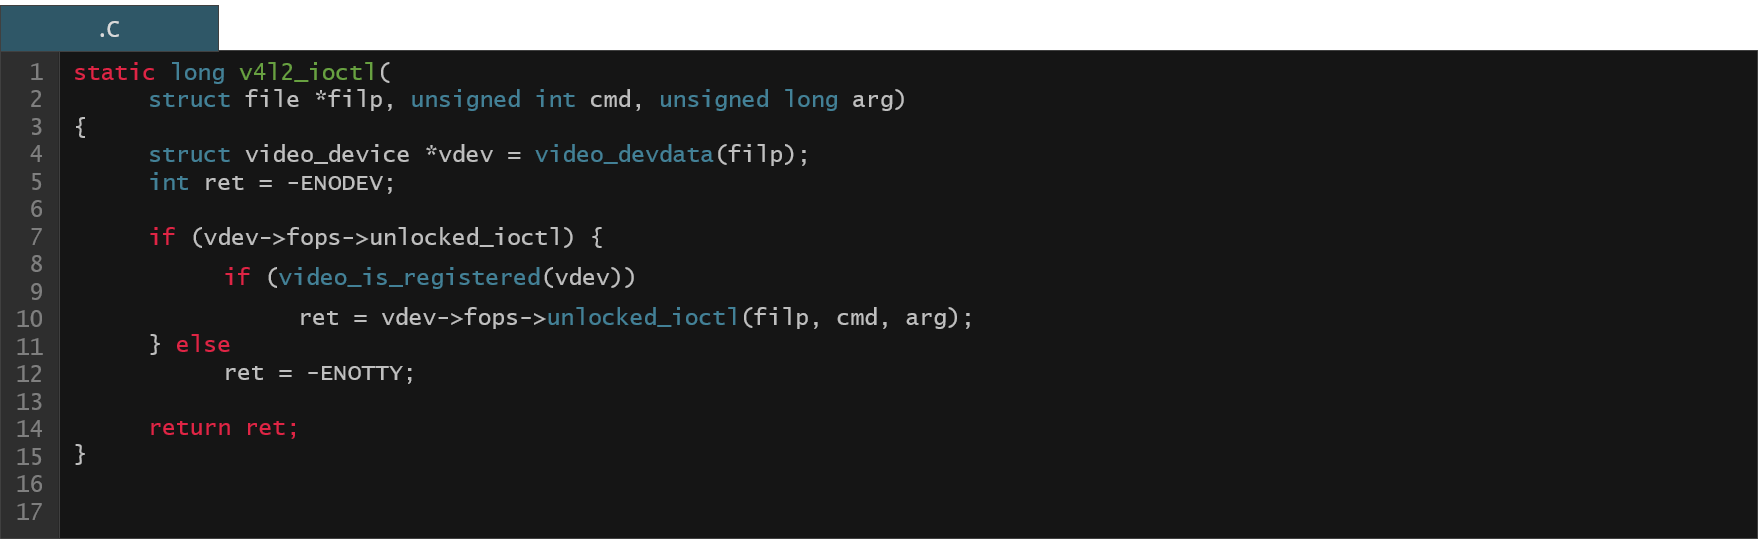
Figure 20. Example code from the Linux kernel v4l2 driver

Figure 21. Excerpt from the JSON information present in the FTDB for the v4l2 driver function from Fig. 20
So we have a function name and a corresponding name entry in the JSON. We have information about the type of all the arguments (types entry) of the function (IDs to the type array in the JSON file), we have information about all the functions called (calls entry) within our function body (IDs to the function array in the JSON file), we have information about all the local variables defined within the function body (locals entry), etc. There's much more like information about various expressions used in the source code body (e.g. dereference expressions of pointers), we have original function body, preprocessed body, etc. One important thing to mention here is that it is possible to reconstruct all the types using the information from the type array of the JSON file. This is especially useful for the C structure types as we will soon see in the following examples.
FTDB examples
Let’s now take a look at some examples how the FTDB database could be used in practice to support productivity of S/W developers.
[FTDB Python API]
Similarly to the BAS, we have a nice Python API that allows for accessing the database using Python programs. It allows for operating on the original C source code in an automated fashion. As an example, take a look at the below code.
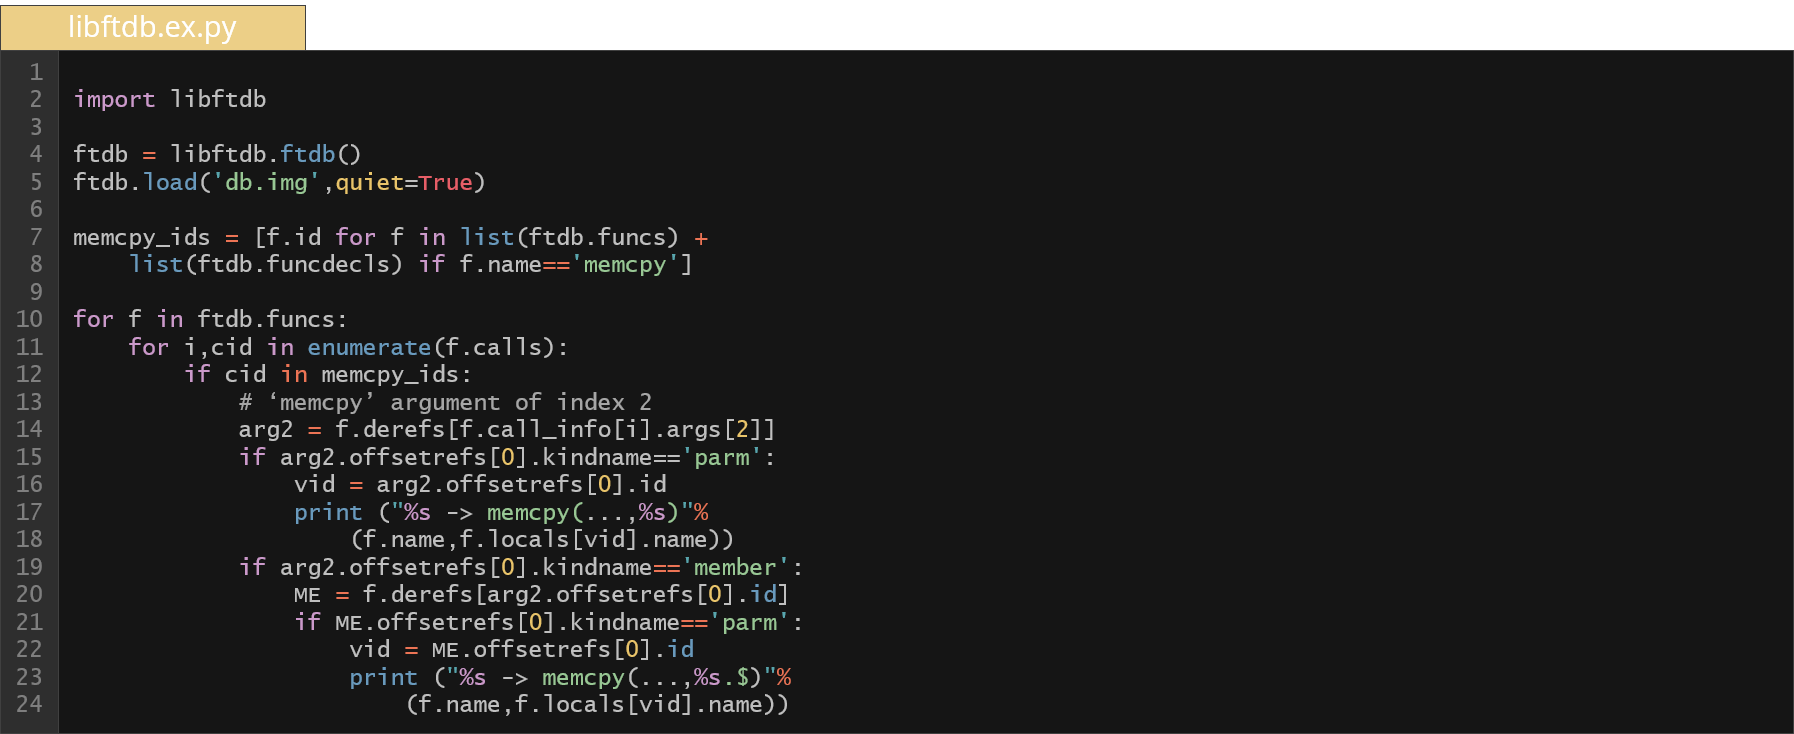
Here we have a few lines of Python code that does some simple static analysis of the original code. More specifically, it checks if any argument of our calling function was passed to the size argument of all memcpy invocations across the code. But why to check that? We want to verify if the data passed as size to memcpy can be controlled by the user. In such a case we could have a potential security problem. In order to check if the size can be controlled, we have to go up through the call hierarchy and find out the origin of this data. So these few lines of code above can find all such invocations (potentially to review) within the entire built kernel code for the Android common kernel (as you can see we have ~700 such results to check).
Similarly, we can write a few lines of Python code to generate an entire call graph of specific function with a given depth.
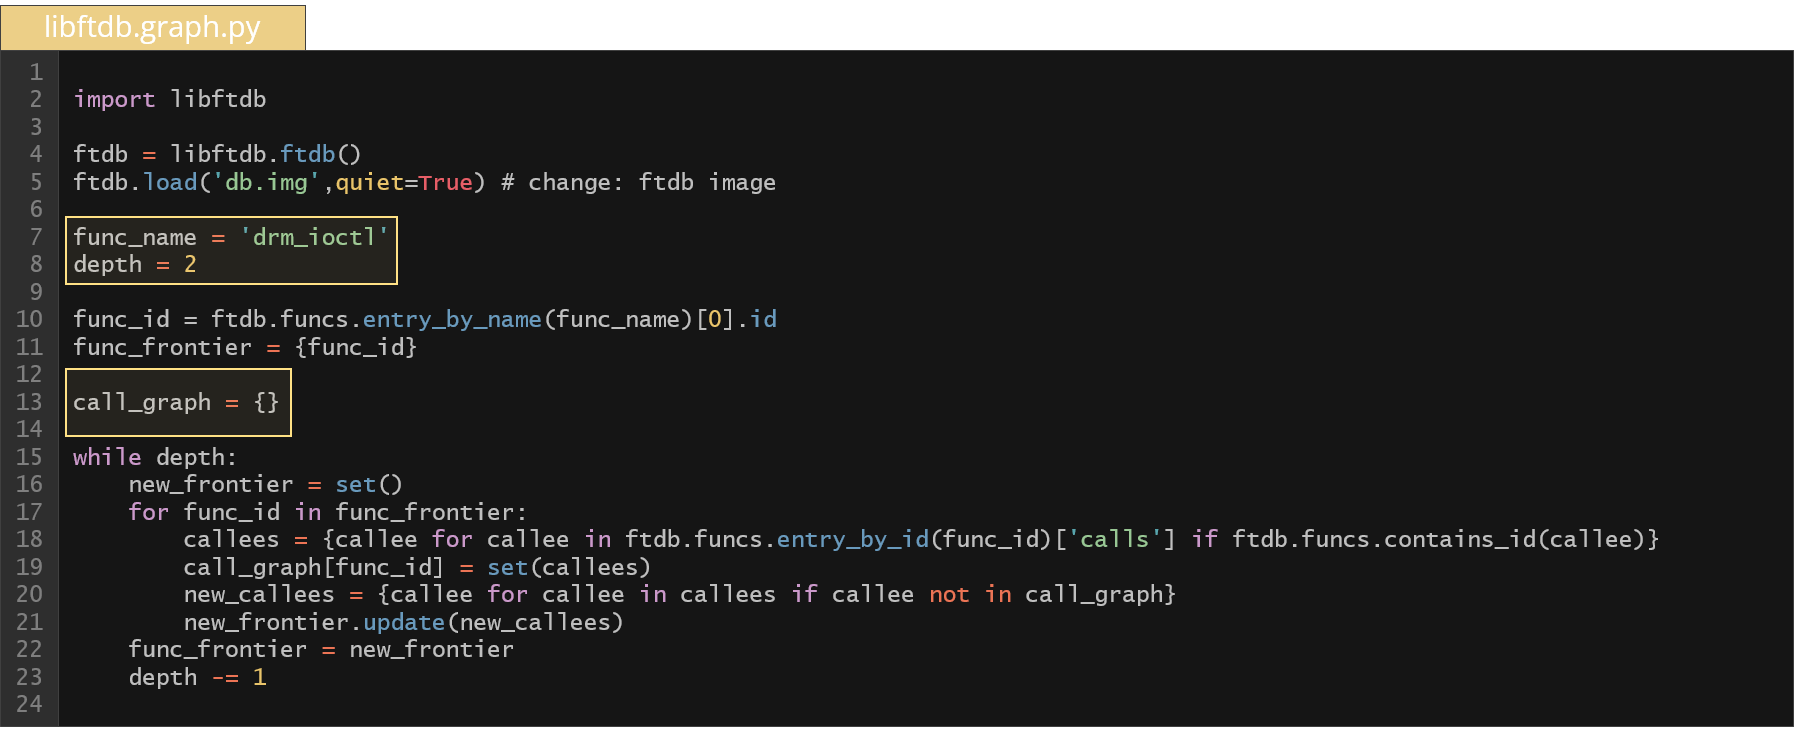
As you can see above, the body of the while construct computes the call graph for a function drm_ioctl with a depth of 2 relying solely on the JSON data. The computed graph is presented below.
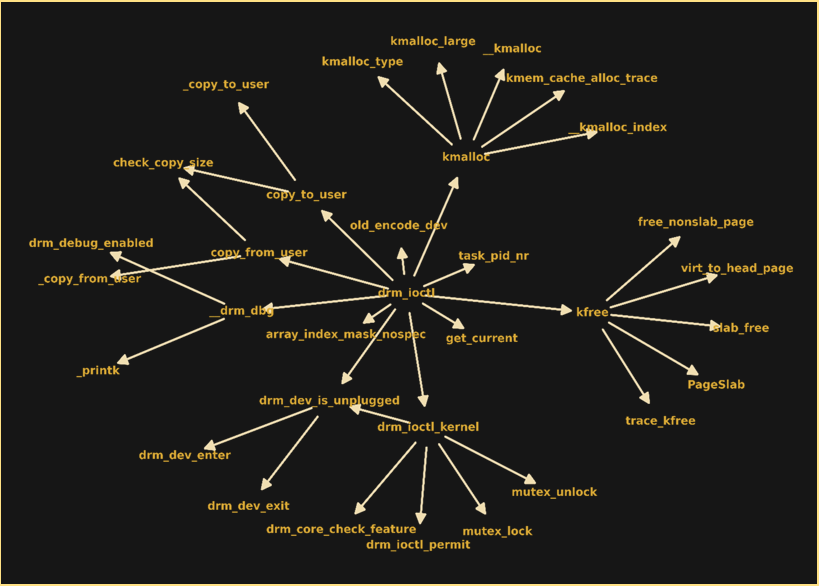
Figure 22. Call graph of the drm_ioctl function with a depth of 2 based on the Android Linux common kernel
[Improved code review system]
You can also build more advanced systems based on the FTDB, e.g. code review support system. Imagine a system that can automatically extract a list of interesting functions and present it to you in an IDE like manner. In such system you would see the original code, the preprocessed code, diffs between the previous release (or different OS version). You would have access to IDE like features, like highlighting identifiers, taint information on the function arguments etc., generally the things that make the source code review easier. You could apply some heuristics that look for potentially erroneous patterns in the code and sort the presented functions with the probability of error in mind. Examples of heuristics would be:
- Cyclomatic complexity,
- Usage of some dangerous functions in the call hierarchy,
- Memory usage patterns.
You could write your own plugins that implement function extraction and presentation according to your target. You could have a nice code search engine where you could create advanced queries to look for some erroneous patterns in the code and extract the list of functions accordingly. All of these features described above are possible to build based solely on the data from the FTDB.
[Structure aware test data]
As it was mentioned previously, the FTDB contains information about all the types which is easily available for applications. This could be used to generate a test data for applications that require a specific structure. Imagine we want to test an implementation of some protocol. The main protocol data structure has a payload field and inside the payload we have some string information (as specified in the example below).

The memory representation of the protocol data looks like as follows:

Figure 23. Memory representation of the struct protocol type
Now we want our test data (that is about to be fed to the application) to follow the specified structure above and we just want to modify the values. Otherwise, if we employ some automated testing techniques like fuzzing, we would end up with a large number of issues (crashes) and most of them would be false positives (and the most common source of errors would be memory errors from trying to follow the invalid pointers). In such a case, we would spend a substantial amount of time reviewing crashes that shouldn't be there in the first place. FTDB contains detailed information about the layout of these structures. We can use it to write a program that will generate the code of the testing application which will initialize the structure fields into the proper format (all the pointers would be properly resolved).
Advanced automated testing techniques
Let's now talk about two more standalone applications that could potentially improve the work and productivity of S/W engineers and both of them rely largely on the CAS/FTDB infrastructure for its proper operation. These applications are Auto Off-Target application and KFLAT selective kernel memory serialization engine.
[Auto Off-Target]
Imagine you need to test a piece of S/W that is otherwise very difficult to test. Let’s say you have some parser code embedded deeply in your WLAN driver. In order to test it, you need to setup a connection; also the data is sent over the air so the possible testing would be very slow as you have a natural limitation in the throughput. Moreover, what to do in case of crashes? It’s not that easy to take the WLAN driver firmware working on your H/W and just run it under the gdb. So you’re looking for some alternatives and one of them would be the off-target testing.
What is the off-target testing technique? We extract the parser code, compile it on our development machine, create the parser executable and we feed the messages directly to the parser through this executable. In such setting we could utilize all the development tools available to us like gdb, we can embed coverage information, we have fuzzers, sanitizers, valgrind, and we could even use symbolic execution. We assume that the parser code doesn’t depend on the H/W very much (doesn’t write to CPU registers directly); it’s just portable C code that shuffles around data between buffers.
The question now is how to create the off-target for the parser functionality? You take the main parser function, extract it from the WLAN driver and try to compile it. Probably it will fail as there are missing dependencies. So you pull more code (more function and type definitions, more global variable definitions) and repeat the compilation process. You probably need to do it many times until the code finally compiles. As you can see, it's quite a painstaking job to prepare the off-target by hand and it can take a very long time. And this process is definitely not scalable.
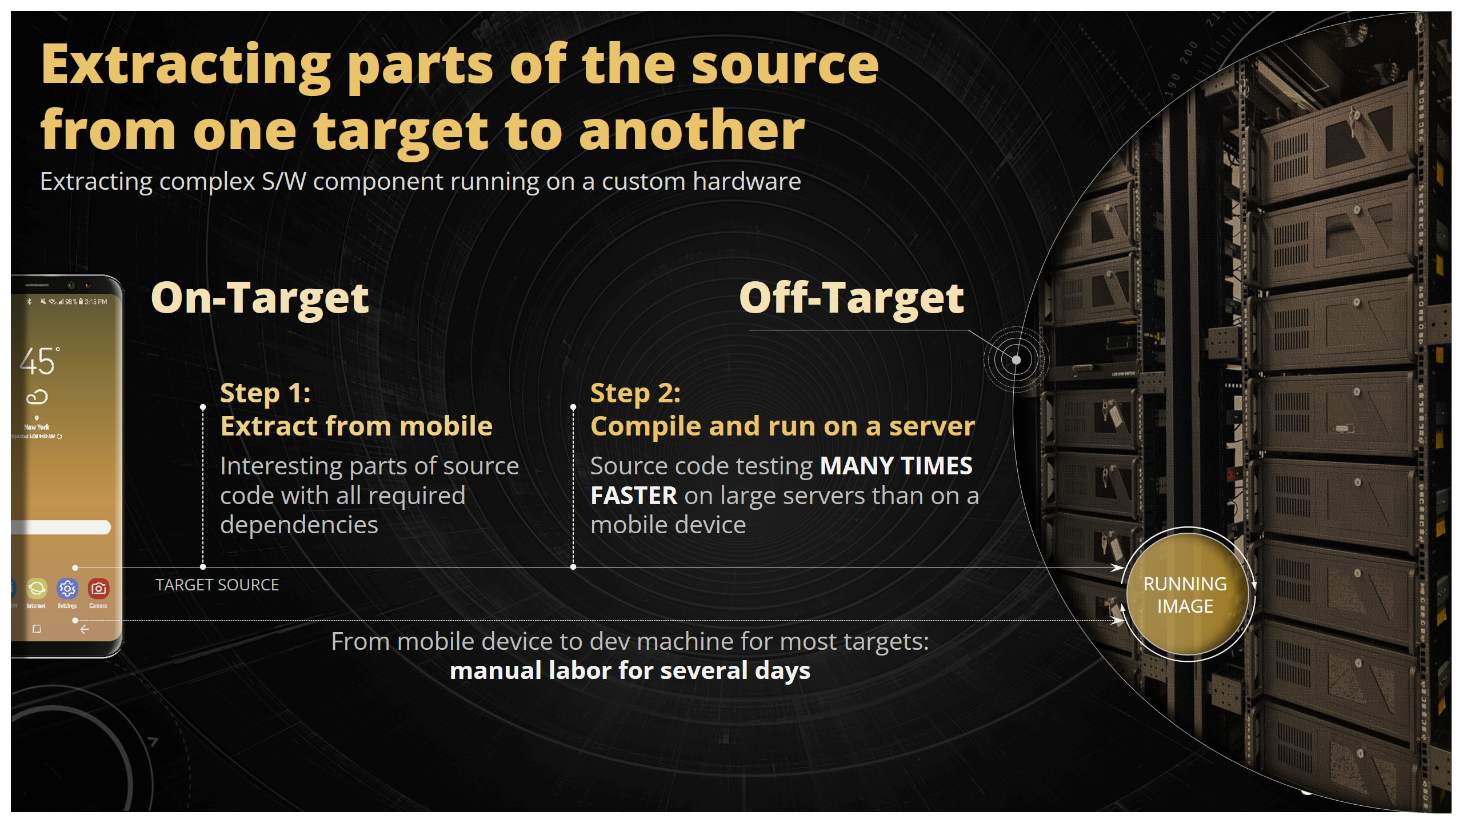
Figure 24. The principle off the off-target testing technique
The Auto Off-Target project was born to actually solve this problem. It can extract a function from a larger system and create compilable off-target harnesses automatically. More information about the AoT project can be found in the paper [2], our talk [3] or on the Github page of the project [4]. The main point to emphasize here is that AoT reads solely the data from the FTDB and operates on it exclusively as it has all information about types, functions, global variables, etc. required to produce the OT code.
[KFLAT]
Another application that could improve the development and testing process of the low-level S/W is the KFLAT project. What is KFLAT? It’s a tool to serialize variables from a C programs. It does so by recursively walking the indicated dependencies of a given variable and copying its memory. It produces the flatten memory image which can be read back almost instantly in the user space process afterwards. Let's have a look again at our previous example of the memory format of the protocol structure.
Figure 25. Reminder of the memory representation of the struct protocol type
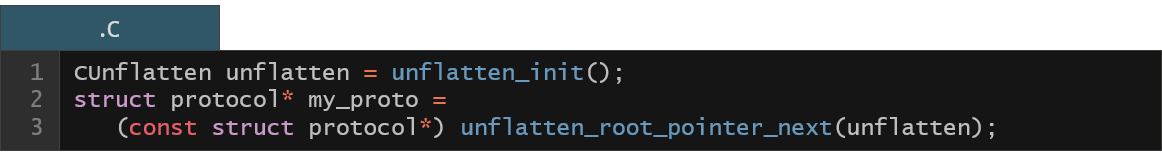
Now, when we have a variable in the C program that constitute an entry point to this memory structure (variable my_proto in the below example), we can pass it to the KFLAT engine as specified below:

The engine will then produce a continuous memory image with all the pointers properly resolved.

Figure 26. Continuous memory image for the struct protocol type as created by the KFLAT engine
Now we can save it to the file and restore it back on a different computer at a different time at a different continent (with just one function call).
You might wonder how the KFLAT dumps the memory of some variable (with all the dependencies). Actually, it relies on the recipes provided by the user to describe the format of the data to be dumped. Each recipe defines a function that is responsible to copy the memory of a given C structure (and run the recipes recursively for its pointer members). Let’s take a look at the structure definitions that describe our protocol data format.

The recipes needed to dump the memory with the payload and other string dependencies would look like as follows:

Let's now see how this can be useful. Imagine a process that needs to compute or read a lot of data before it starts doing something useful. A very good example of that would be a very large build system that takes several minutes to just read all the makefiles before it gives you small incremental build. Android build system was like that in the past. Now it's significantly better but I'm sure you can still find similar build systems in the wild. What we could do here is to prepare the snapshot of all the parsed makefiles in the memory, then create a flatten memory image using the KFLAT, save it to the file and when we run the build again (and assuming that makefiles didn’t change), we could just read the build configuration in a matter of milliseconds.

Figure 27. Caching and restoring the userspace process memory using the KFLAT engine
KFLAT also works in the kernel (we also have C variables there). One of the examples of KFLAT operation inside the kernel would be extracting some debugging information from the running system (or getting periodic snapshots of data for the system tracing purposes). Below we have an example of very simple recipes to dump task_struct information from all the processes in the Linux system (which is the main structure in the kernel that describes the Linux process).
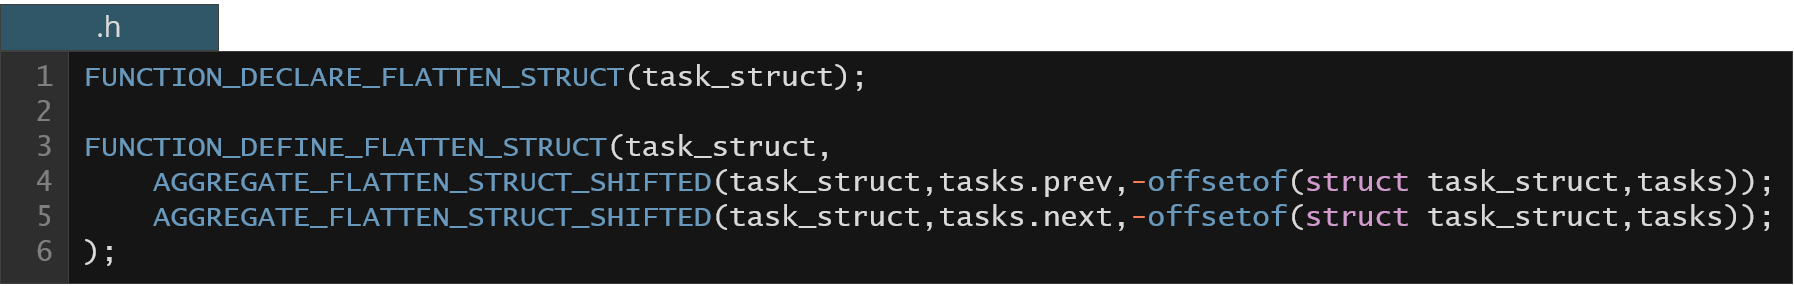
Structure task_struct is actually a very big structure. The above recipe doesn't follow any further dependencies, meaning we will meaningfully dump only plain data variables (i.e. excluding any pointer variables), however, it still can be useful for some system data analysis. Below we have an example output of the user space application that actually reads this dump and prints some information about system processes.

Figure 28. Example of user space application processing the process information from Linux kernel memory KFLAT based dump
We've just touched upon one of the problems with KFLAT serialization – sometimes the dependencies might be really huge (in the case of the task_struct Linux kernel structure we would need to follow around three thousand dependencies in order to prepare the correct, fully serialized memory image). It's very difficult to do it by hand. And again, the FTDB comes in handy at this point! Remember, we have full detailed information about all Linux kernel structures easily available to external applications. We can try to write a recipe generator for the Linux kernel serialization using KFLAT.
If you’re interested more in KFLAT or recipe generation, you can see our talk at the Open Source Summit 2023 [5] or you can visit the Github page of the project [6]. The main point though is that based on the FTDB we can generate mostly correct recipes to serialize variables extracted from a very complex S/W system (like Linux kernel).
To summarize the Function/Type Database (FTDB) concept, it can be used to improve the review process of the C source code by providing an engine for writing plugins to automatically find vulnerable functions and help in the code review process. It can help with automated testing by allowing for structure aware test data creation. Finally, it enables the possibility for automated generation of off-target test harness extracted from a larger system dedicated for the automated S/W testing and issue detection.
Summary
In this article we described the Code Aware Services (CAS) project which serves as a foundation for creating other tools that improve the productivity of engineers working with system code. We demonstrate that our process and dependency visualization tools equipped with execution time measurements and the Python BAS API that gives easy programming access to the raw database can provide deep insight into the product build operation. This insight can help solve build failure problems and investigate build speed bottlenecks. We also demonstrate that custom build script generation can directly address the feedback cycles problem by providing means to replay specific parts of the build where the configuration didn't change. That enables the possibility of fine-grained incremental rebuild of selected pieces of the underlying systems. Our presented code search and IDE indexing improvements boost the productivity of developers working with the code. Finally, we demonstrate that leveraging FTDB helps us automate the code review process as well as opens new range of possibilities in automated testing. We show our novel Auto Off-Target approach that makes it possible to generate off-target test harnesses at scale. Finally, we present our KFLAT system which allows us to capture and serialize data and use it for off-target testing to help fuzzing tools keep the bounds and the structure of the input data in check or to speed up the load time in I/O-intense applications.
References
[1] Build EAR
https://github.com/rizsotto/Bear
[2] Tomasz Kuchta, Bartosz Zator
Auto Off-Target: Enabling Thorough and Scalable Testing for Complex Software Systems
https://dl.acm.org/doi/10.1145/3551349.3556915
[3] CAS & AoT: Enabling Symbolic Execution on Complex System Code via Automatic Test Harness Generation
https://www.youtube.com/watch?v=Xzn_kmtW3_c
[4] AoT: Auto off-Target @ Samsung Github
https://github.com/Samsung/auto_off_target
[5] KFLAT - Selective Kernel Memory Serialization for Security and debugging
https://www.youtube.com/watch?v=Ynunpuk-Vfo
[6] KFLAT @ Samsung Github
https://github.com/samsung/kflat